Now that you've got the developer tools open, let's see what's going on in there!

There are four separate parts to the developer tools screen, numbered in the image above. Note that I'm viewing the tools in full-screen, but you could have them either on the bottom or side of your page as well.
You have buttons to select an HTML element directly in the web rendering and another model for testing different devices. You'll see this later in the course!
Here, you'll find the navigation menu, full of tabs that all help you debug and code in different ways.
This biggest chunk of the screen shows information about the current page.
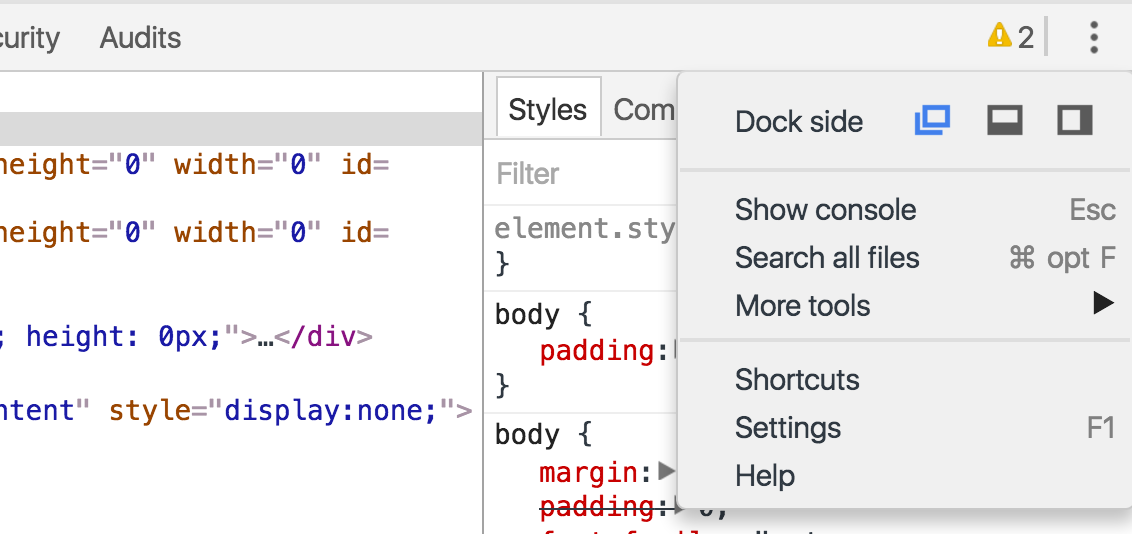
The top right will show you errors and also lets you tweak the developer tools settings.
Tabs
There are nine tabs present in the navigation menu, and each tab contains various information and tools.

This course features a chapter on each of the above tabs, but let's take a quick look at each before going any further.
Elements: this screen displays the HTML of the page. You can even edit the HTML and CSS of the web page directly! Note that these changes won't be saved once you refresh the page though.
Console: the JavaScript console lets you see and write JavaScript to accompany the HTML and CSS seen in the Elements tab.
Sources: this tab lists the different files loaded to display this page (HTML files, CSS files, images, and more). You can also add breakpoints here so the code stops and starts running at certain points that you set.
Network: this screen shows the file loading order, with their transfer time and additional information like their statuses, kinds, and sizes. You can also see client requests and server responses here.
Timeline: the Timeline tab shows you the timeline of things happening within the browser.
Profiles: this screen displays even more detailed information on the timeline and memory usage of your page.
Resources: this tab lists the information stored and/or used by the browser such as cookies and cache-related data, as well as the resources loaded into the page.
Security: the Security tab displays information regarding the safety of the current page (SSL certificate validity).
Audits: this screen scans a page and provides recommendations for improvement.
Depending on the type of development you do, you'll probably spend most of your time in just a few of these tabs. I am personally in the Elements tab all the time, but you'll set your own habits!