The Network tab lets you see information about network activity on your page. You can see HTTP headers, timing data associated with each item loaded on the page, and more.
Here's the test page loaded in the Network tab. You can see information regarding each bit of network information:
Name of the item
Status (often HTTP code)
Type of item
Initiator (what kicked off the item's loading)
Time the item took to load
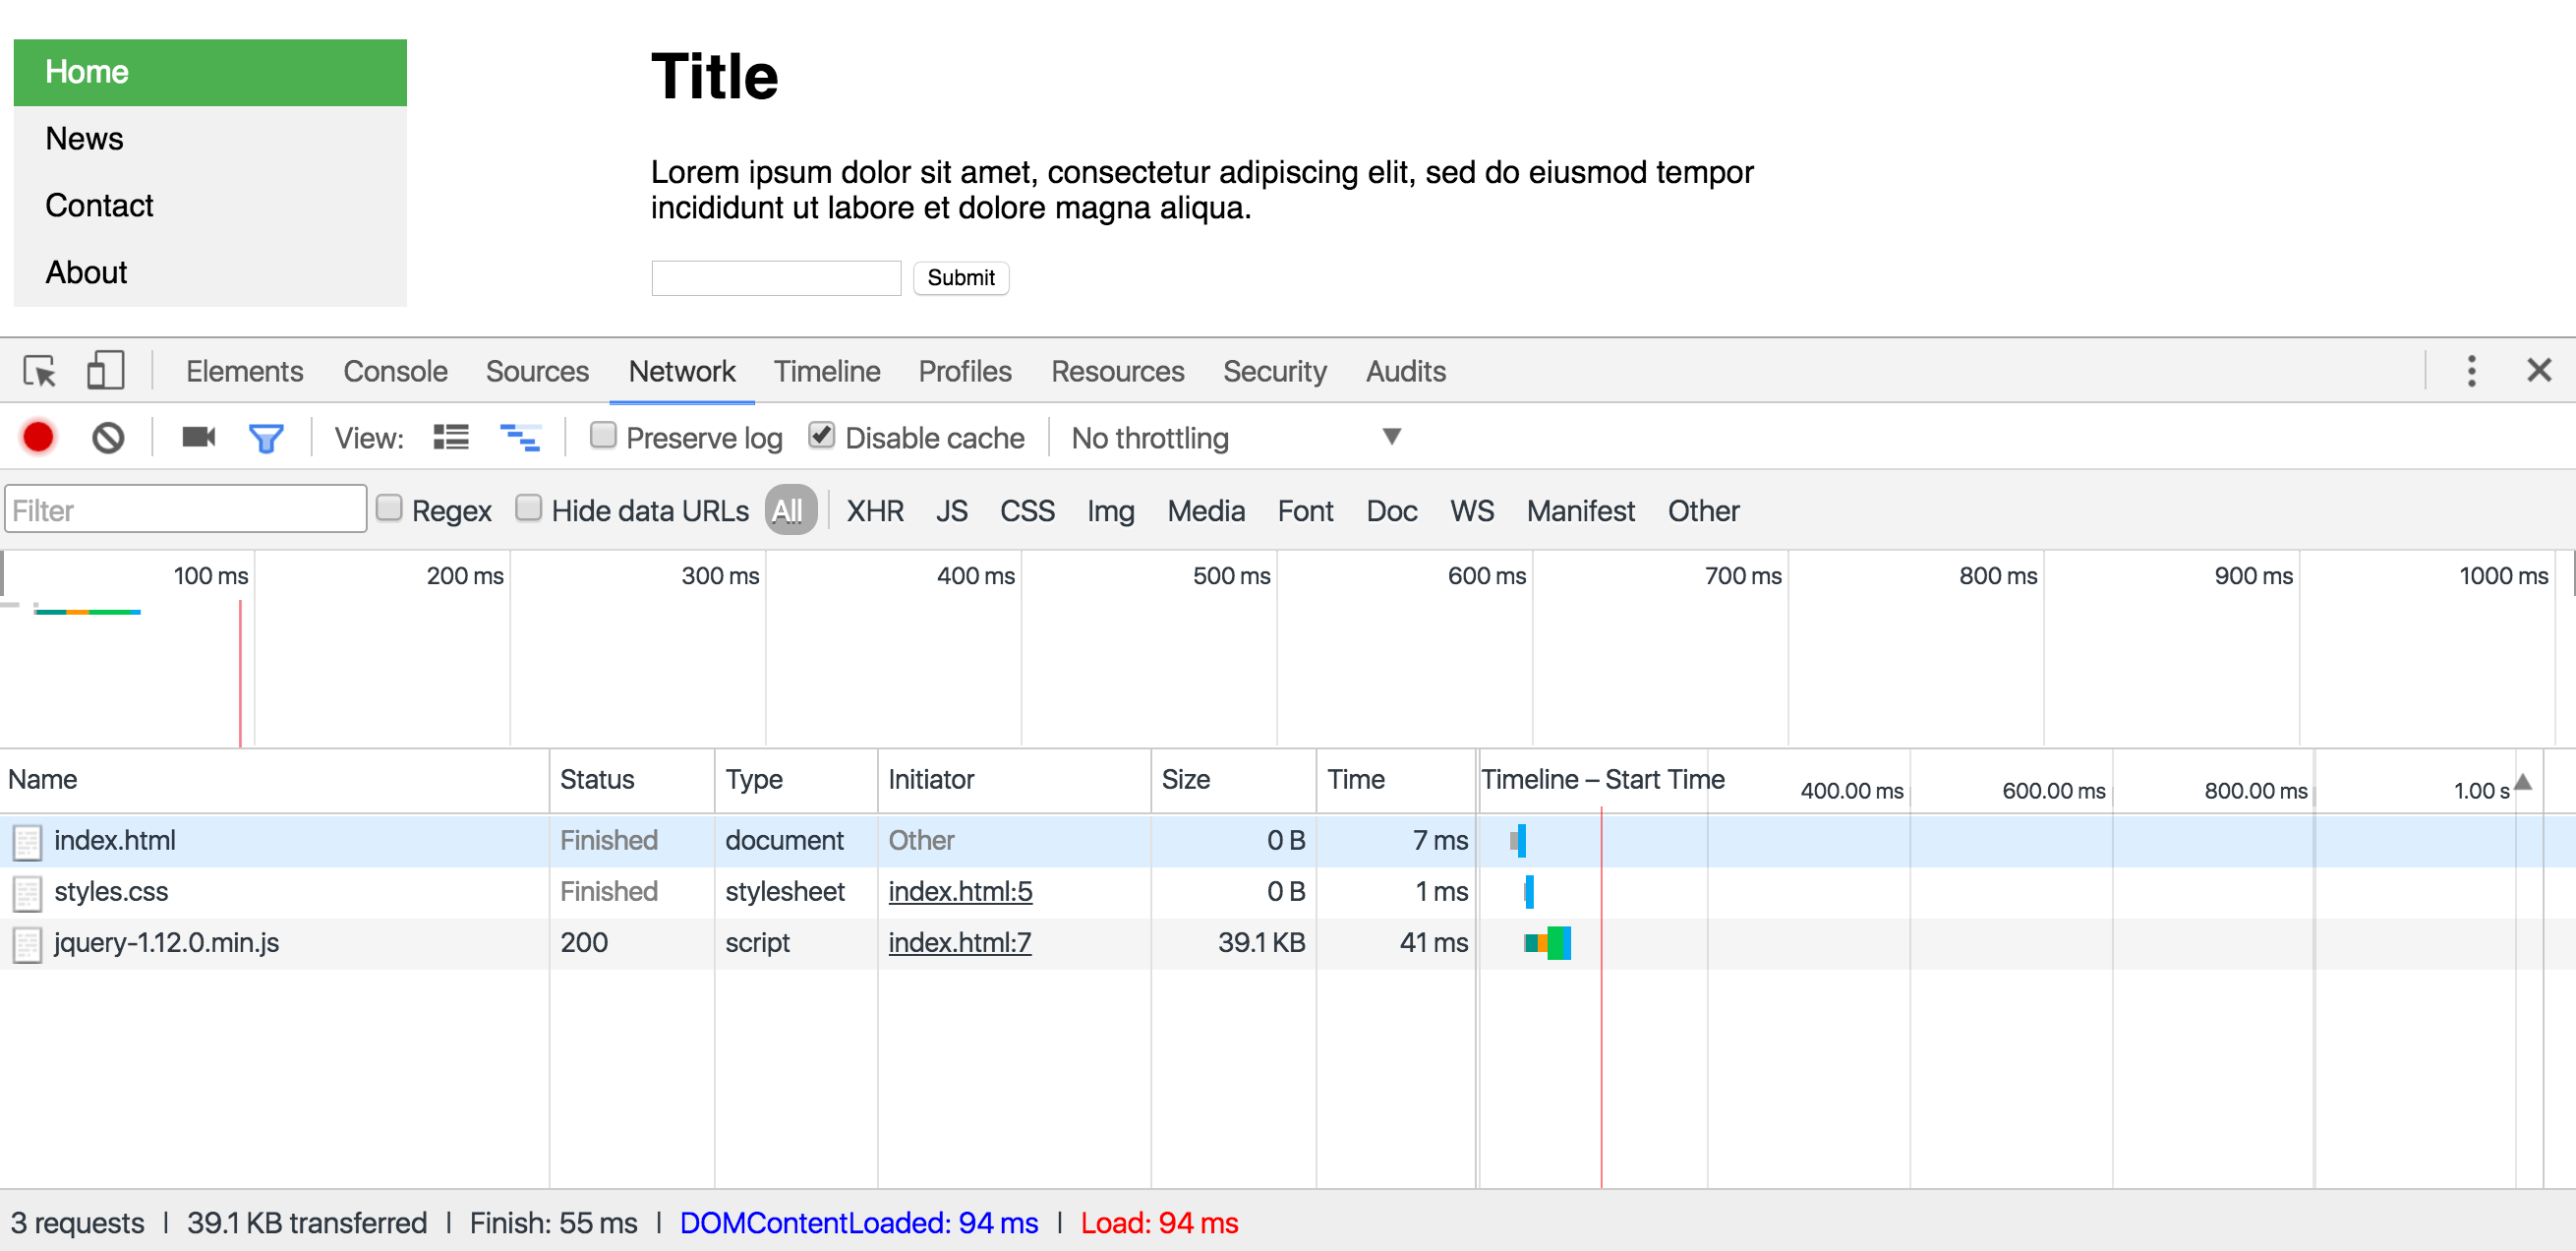
You'll immediately see three files loaded: the HTML document, the CSS stylesheet, and the jQuery that accompanies the project. Pretty simple! You can also see the size of each file.
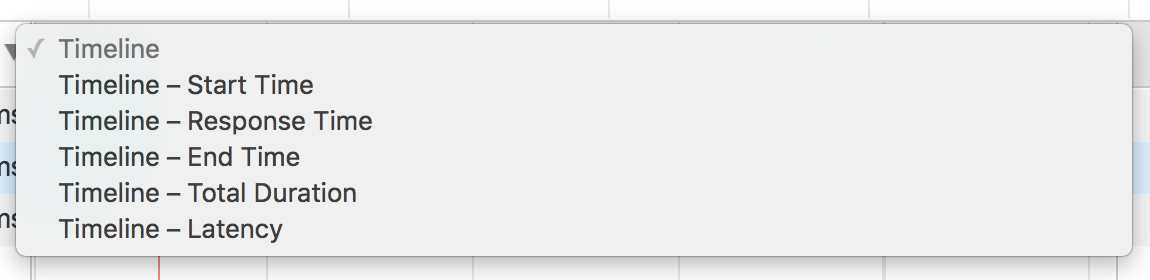
You also have a timeline chart on the right hand side, indicating where each item fits therein. Sort it based on different criteria:
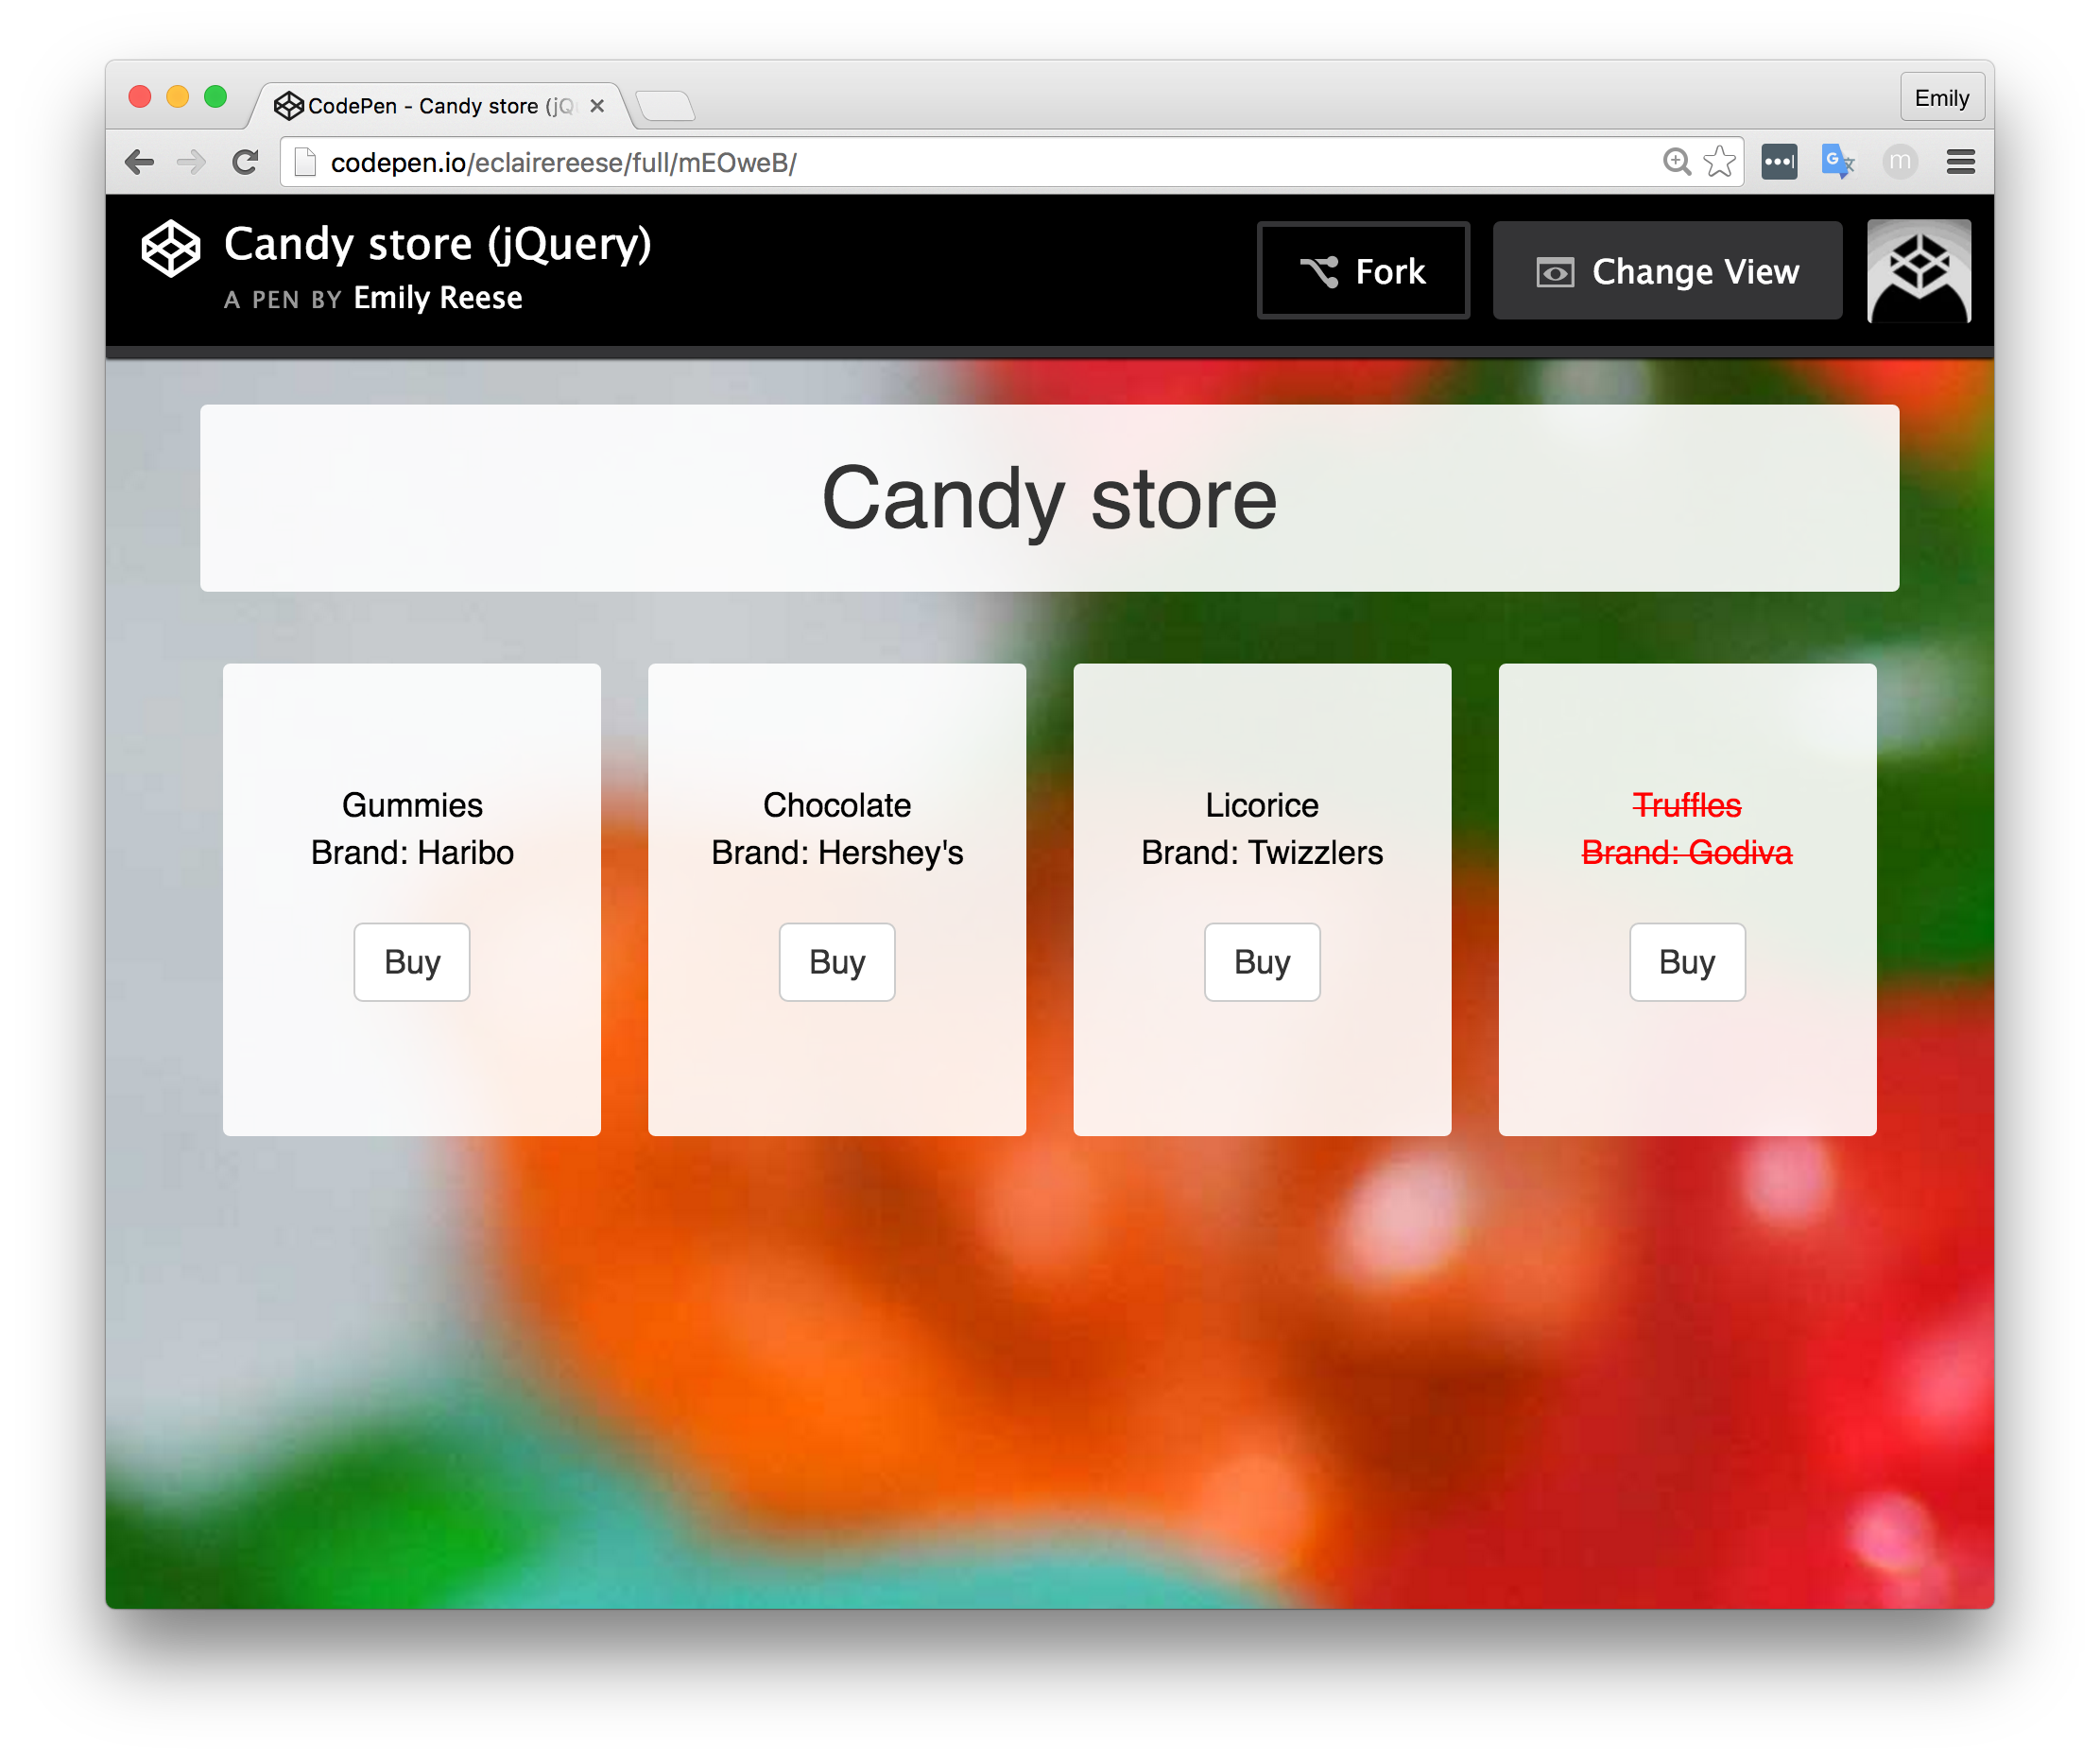
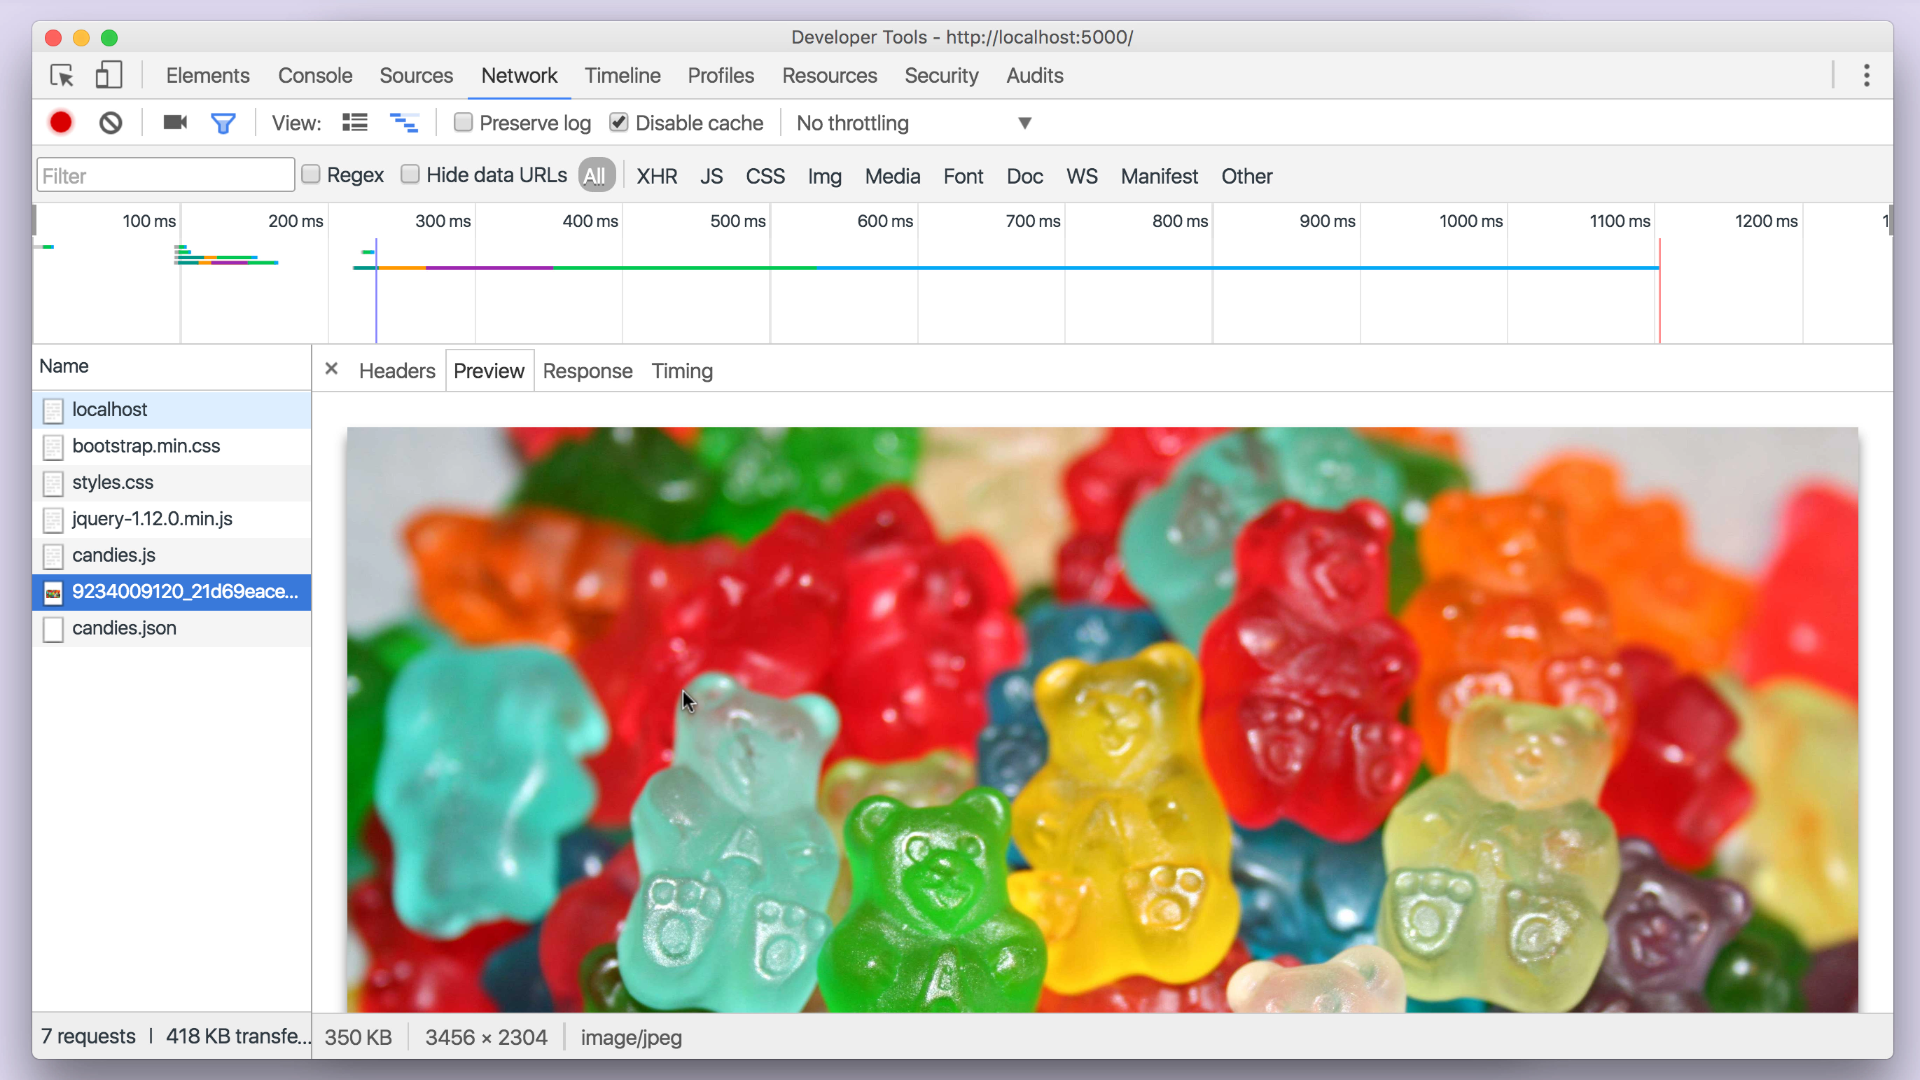
Let's se a more complicated example, taking a webpage that loads an image and an external JSON file. Here's a simple fake candy storefront that you may have seen if you've taken JavaScript or jQuery courses on OpenClassrooms!
Loading it in the Network tab brings up the following result, in which I've clicked on the JSON file (loaded via AJAX). You'll notice you can even see the contents of the external JSON file, which is exactly the data the browser received!
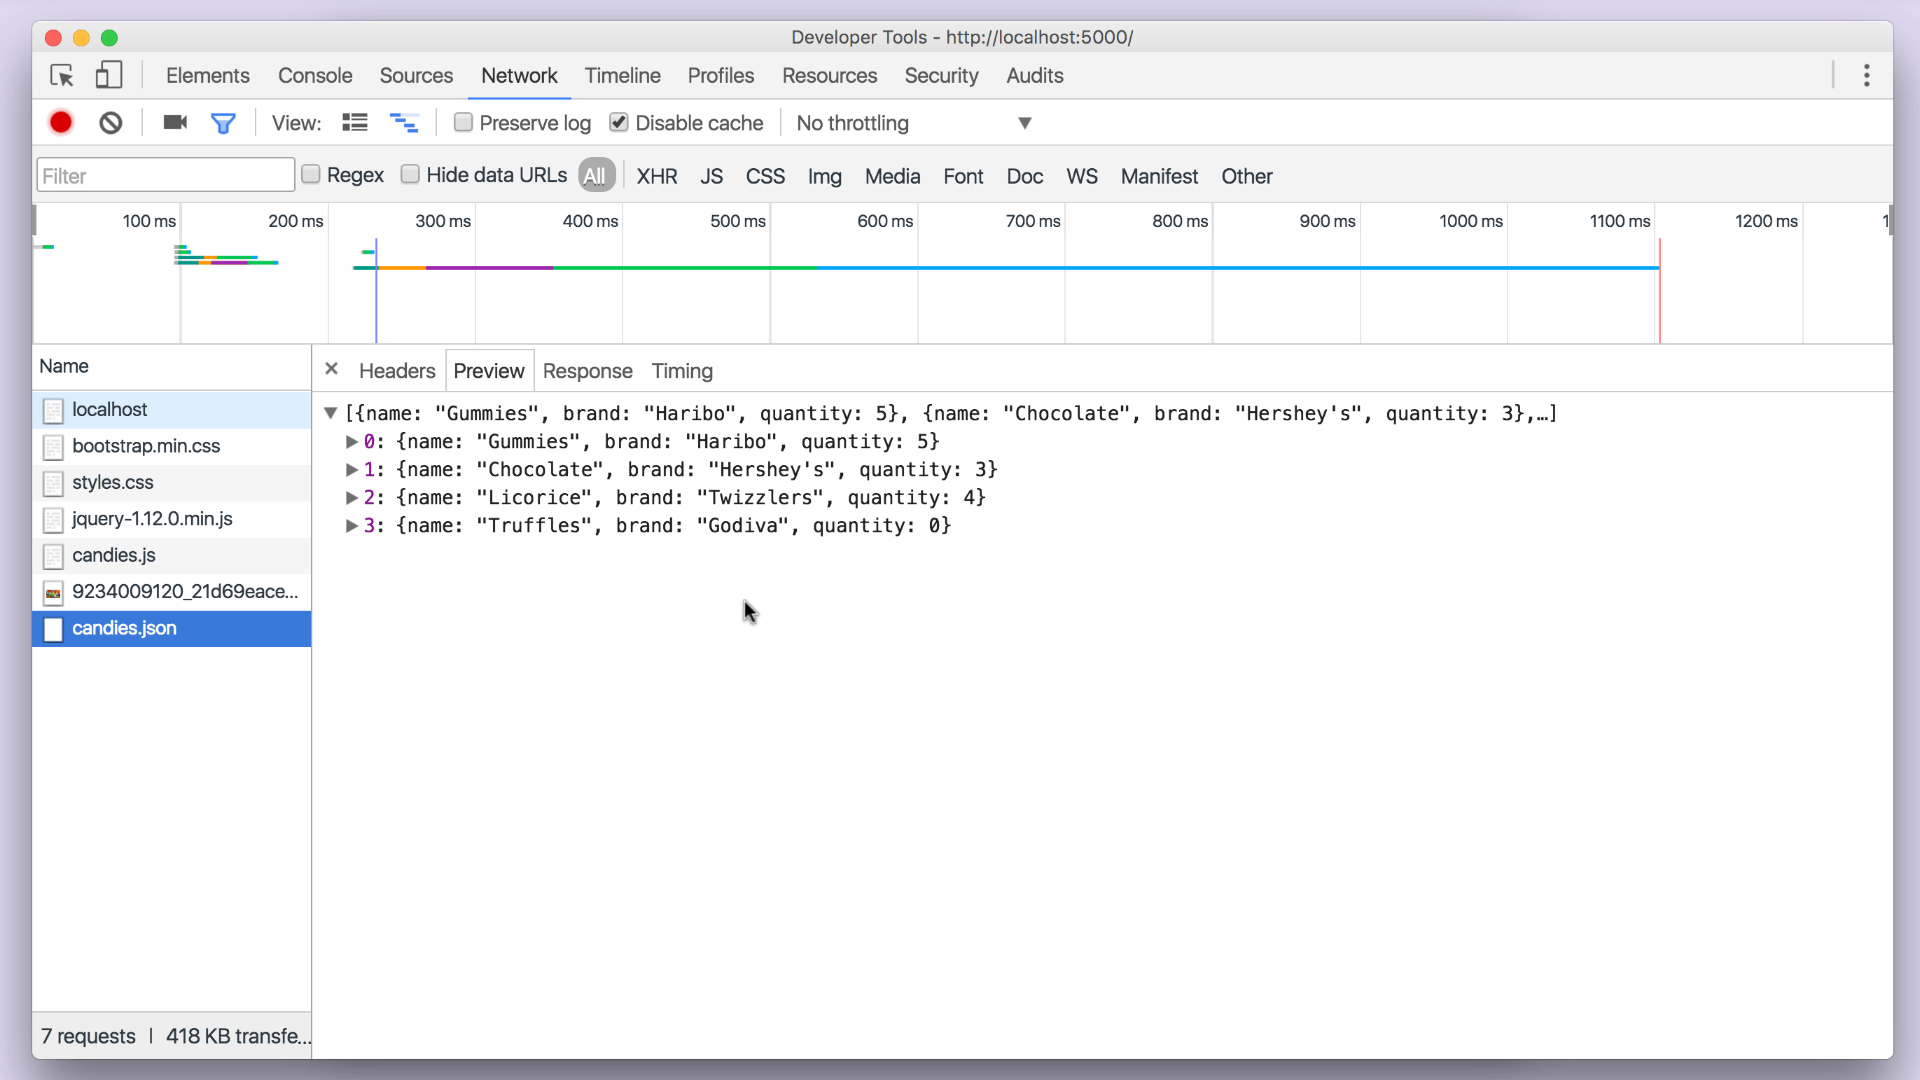
By clicking on the image file in the left list, you can also see the exact image that was loaded in.
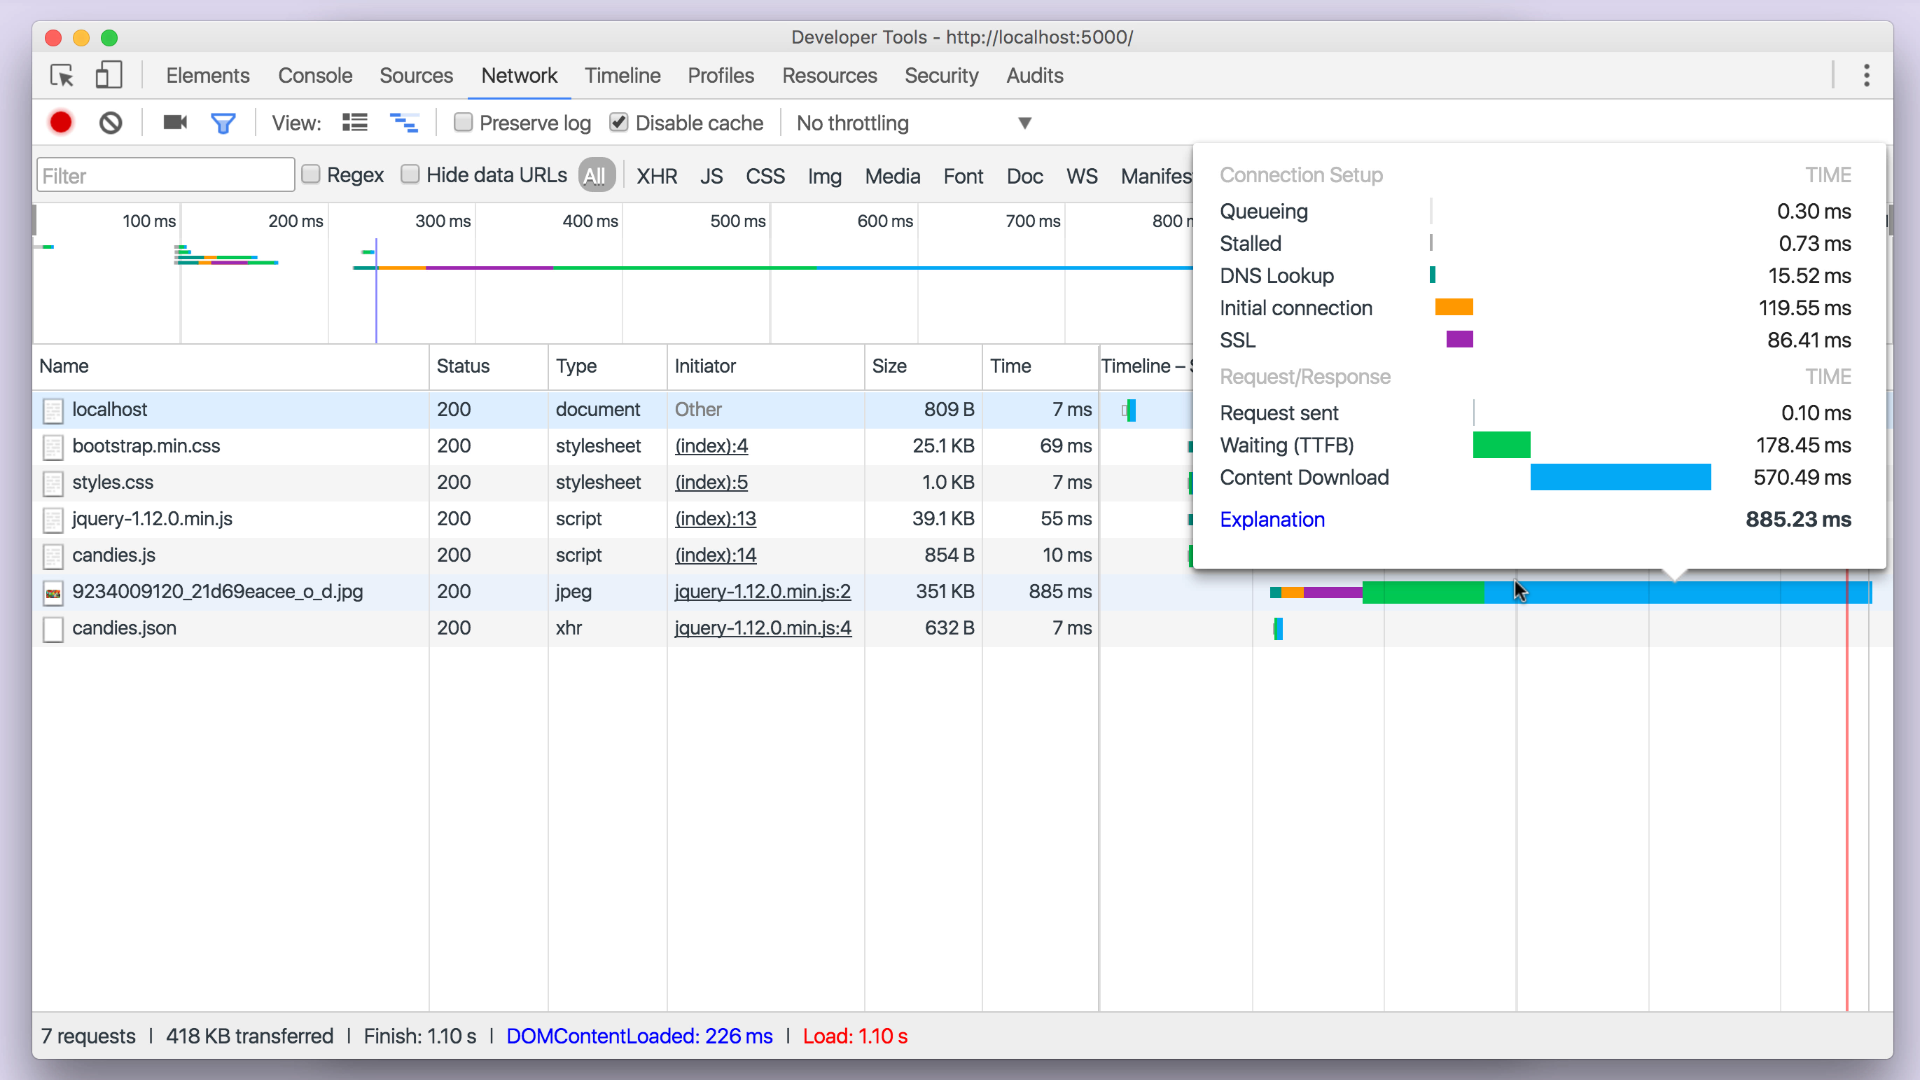
That's all cool, but a lot of it you can do via other developer tools tabs. However, for every item loaded into your web page, you can also see the time it took to load the item. For example, I can see that the image took the longest to load in my webpage. By hovering over its associated bar, I can even see a breakdown of what took the longest in the image loading process.
Filters
Notice that you have a series of buttons, called filters, such as "All," "XHR," "JS," "CSS," etc. By selecting one of these filters, you'll only see the terms that match these criteria. For example, if you're trying to evaluate only your image load times, selecting the "IMG" filter would be a great choice.
Visit your favorite website and, while it's loading, check out the Network tab to see what's behind the amount of time the page takes to load!