You have created your first Java program. Now, let’s take a look at a few other things that make Eclipse such a cool IDE to work with!
The main view
The main view refers to the user interface we see when we first open Eclipse. Let's check it out together in the video below!
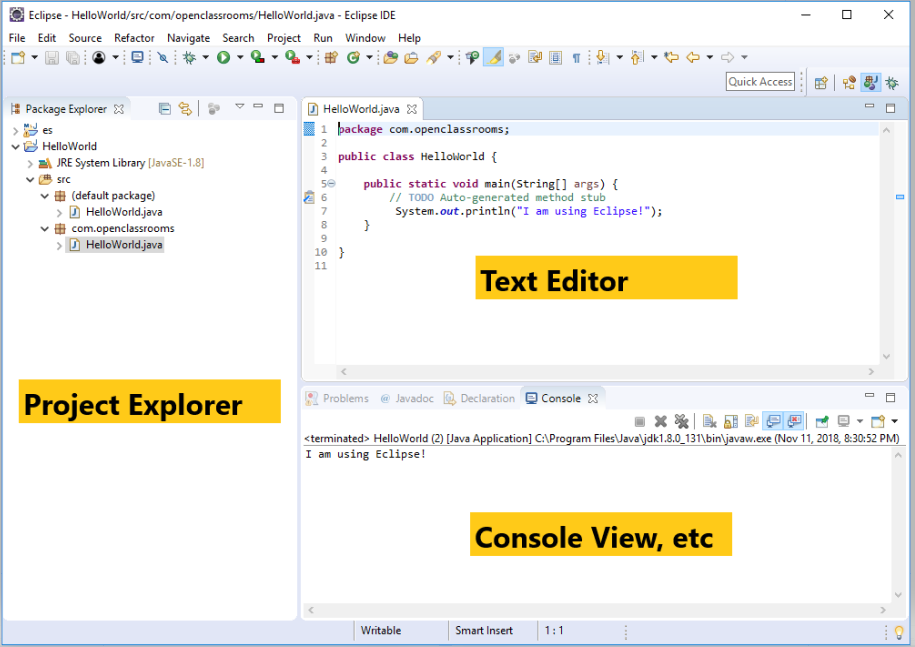
When you open up the IDE you will see three main sections: the Package Explorer (or Project Explorer), the Text Editor, and the Console at the bottom. Here's a quick recap of how they work:
Package Explorer
Go to File -> New -> Project and click on Other to see all the different kinds of projects you can create.
When you create them, you can see that you can manage all of your projects under the Project Explorer.
Console View
On the bottom pane.
It has a few other tabs that can show you issues with your program execution, among other things.
The console can be tweaked to expand, or if you click on it, it will expand to use the full window.
The Windows
There are several views on the screen, and sometimes you may want to move things around based on your priorities (such as appearance).
If you have closed too many things and want to hit reset, just go to Window -> Open Perspective -> Reset Perspective to get back to where you were.
Toolbar
The toolbar is handy because it has most of what you need in little icons at the top.
Take the time to check out each of the functionalities.
How to debug in Eclipse
One of the cool things about Eclipse is the integrated debugger. If you've got a lot of code, and things are going wrong, debugging is a useful way to check through it. For example, imagine you have a runtime error.
Since it's not a syntax error, you’re not sure where the problem is. With a debugger, you can move through your code, stopping and starting at specific points. This allows you to check it section by section, which helps you understand what your code is doing and where the problems began.
To demonstrate how to do that, using Eclipse's debugger, we're first going to have to make a little change to the code we've been using:
package com.openclassrooms;
       public class HelloWorld {
               public static void main(String[] args)  {
                       int i;
                       for (i=0; i<3; i++) {

                             System.out.println("Welcome to Eclipse! ");
                          }
                  }
         }
Now that you've got the code you need, follow along with the video below to learn how to debug using Eclipse!
Debugging takes a bit of practice, so let's break it down a bit more. Don't hesitate to review the video a few times!
Setting breakpoints
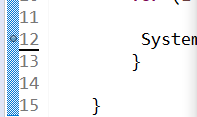
To stop and start the program, we need breakpoints. These allow you to stop a program wherever you set them. Let's set a breakpoint in the line where the code prints out our message. You can do that by going to the line number, right click and click "Toggle Breakpoint." You will see a small blue dot show up next to the line number. You can also remove it by clicking Disable Breakpoint.
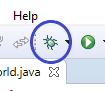
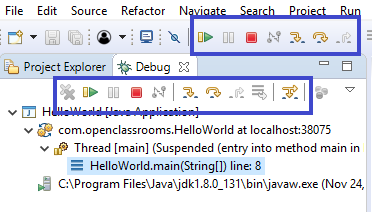
Now, locate and double-click on the Debug button on your toolbar. It looks like this:
You will see a box come up asking you to "Switch” the perspective to bring up the debugger windows. Go ahead and click on Switch.
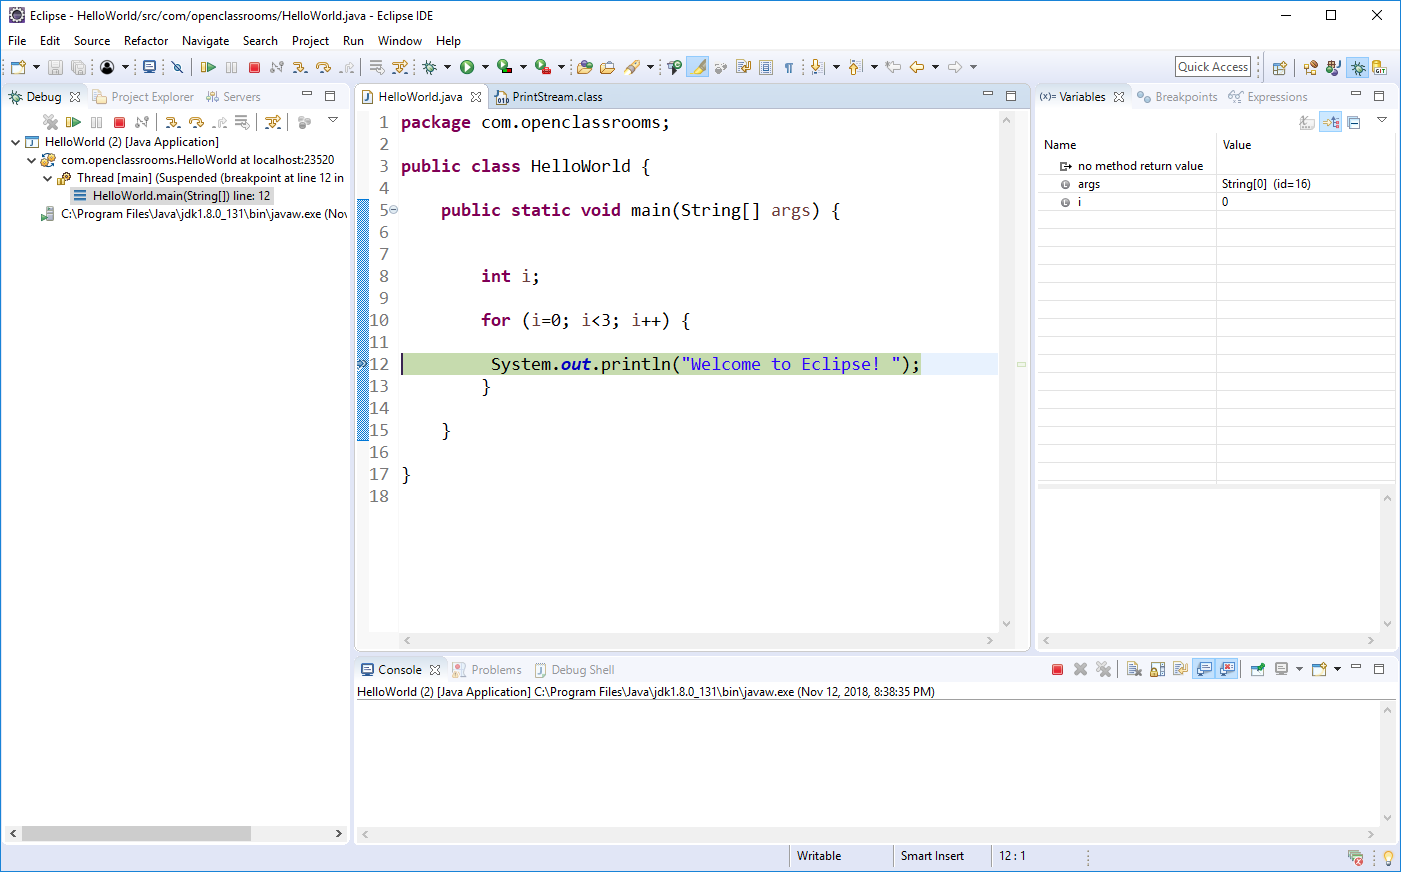
On the left side, you will see the Debug tab. See that green highlight on print? It shows where the line has not been run yet. You can double check this by looking at the console application: there is no printout! This is evidence that the program was run then stopped right before the breakpoint.
On the right side, you will see what the variables are equal to at the moment. You can see that i is equal to zero, which means it has entered the for loop but has not iterated to the second loop yet. If you go back to the Debug tab, you will see where it has stopped. You can now "step into" the program by clicking the arrow in the Debug tab's toolbar or the main toolbar as indicated below.
Notice that it will take you to a Java dependency. Println is a method that is defined in the PrintStream class that Eclipse automatically pulls! Neat, huh? This shows where the program goes next, which is to a file that you cannot see in your project.
Now click on the Step Over to continue iterating through what the program does. When you click it a few times, you will see how you have gone through the second iteration of the loop and the console now shows the first printout of the println statement.
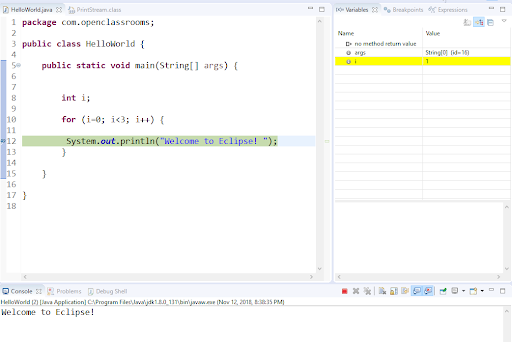
Now that it has entered the for loop for the second time, it has printed out the statement and i is now equal to one. If you continue to click on Step Over, you will see that it will continue to each step of the program until the for loop breaks (when i is equal to 3.)
You are done debugging! How can you get out of this perspective? Go to Window and Reset Perspective. But, there is also something else I’d like to show you about perspective: a cool tool called Maven.
What is Maven and why do I care?
Maven is a powerful tool created by Apache that will make a web development project easier from start to finish by automating everything! Let’s check it out.
Let's recap these steps!
Set up the perspective
If you go back to Window -> Open Perspective -> Perspective, you can see the different kinds of tools available for other types of projects. You can see here all kinds of projects that you can create that are supported by Eclipse.
Click on Java EE to switch to the Web Development perspective. The screen will take you to the layout for web development that will have specific options.
Make a new Maven Project
From here, go to File -> New -> Maven Project. Click the Create a simple project option and then Finish.
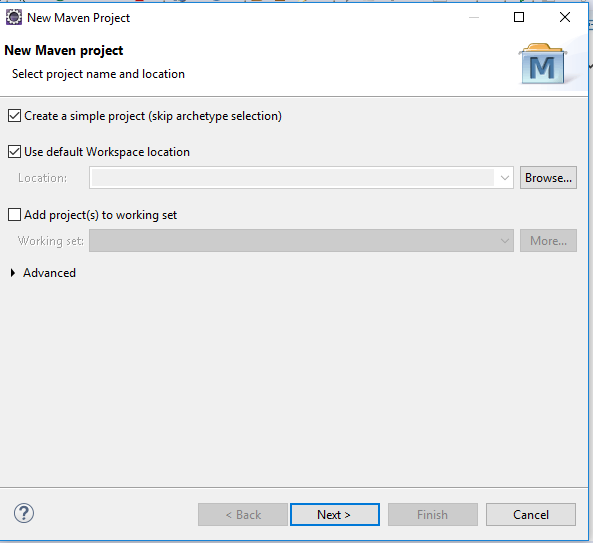
In New Maven Project, fill in a Group ID and Artifact ID. You will see that the packaging is JAR which is an archiving utility for multiple Java classes and files. It allows you to compress files and store them, kind of like a zip utility for Java. JAR files are an archive of several Java files.
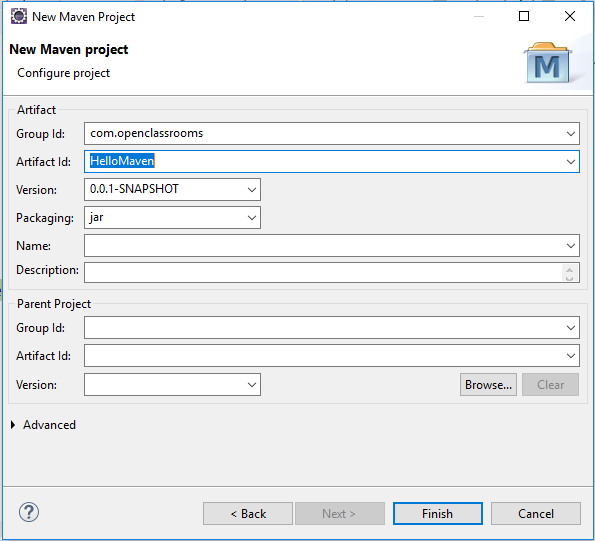
Click Finish and you will see the new Maven project appear in the package explorer on the left.
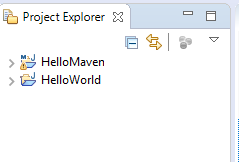
Now you have two different projects in Project Explorer: the Java SE project with the HelloWorld class and the new Maven project. When you open it up, you will see multiple files. Why is this important? First, you will see the src/main/java. This holds all of your classes for the project.
Remember that web development projects folder holds multiple files and folders. By putting specific Java files in specific folders, Eclipse will know how to make the web application work just like it's supposed to!
Web development requires testing as you go along, and so you will see folders for src/test/java. Both have resource files that hold some of your dependencies. Maven has its own repository of dependencies so if you need specific JAR files pulled in to your code, Maven will do it for you, thus automating the entire process!
Test your methods with JUnit
One of my favorite features of Eclipse is JUnit. It will provide you the framework you need to run tests on all your methods in your program. You see, when your code has a lot of methods that each do something different, you want to make sure that you test each one to ensure you don't have bugs in your code. Using the JUnit framework, you can automate and integrate test functions into your project! Let's try it out.
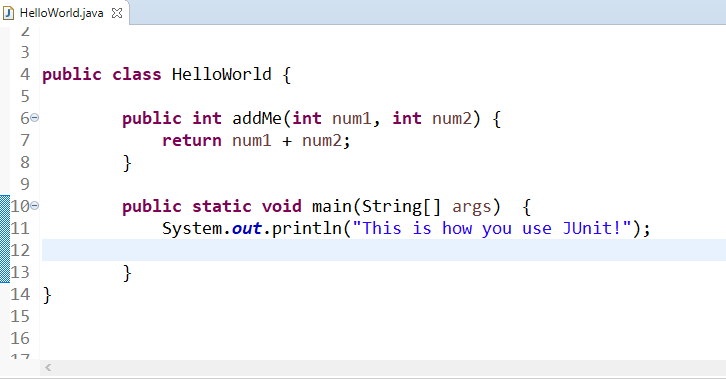
Now let's go back to Eclipse and use a function that we can test. I will create a function to our HelloWorld class that will add two numbers.
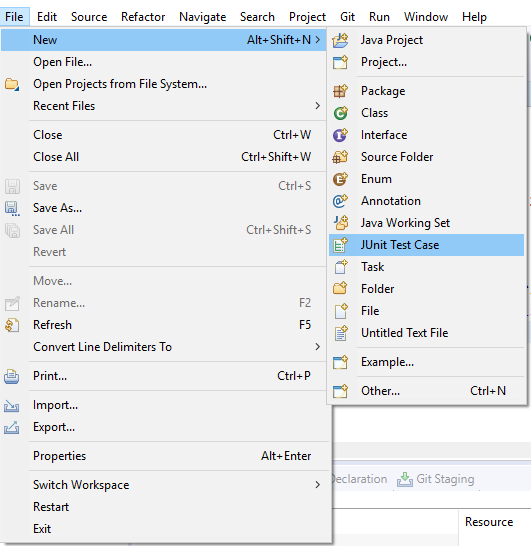
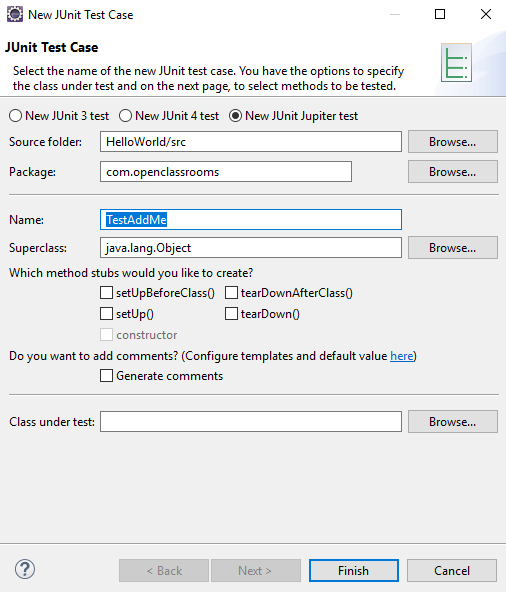
Now let's look at how we can use JUnit to test the add method. Go to File -> New -> JUnit Test Case
You can name the Test Case by adding test before the name of the method using Java's naming convention. In this case, I called it TestAddMe and then click Finish. Your project can have multiple test case files or one depending on your style.
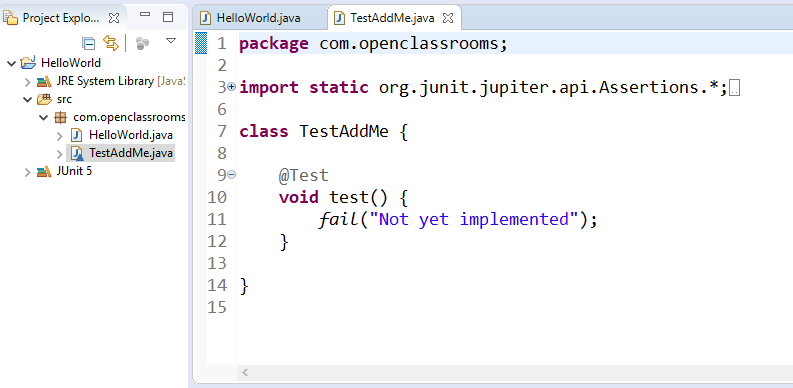
You will notice that your test case will appear as a separate class and will provide you the skeleton to define your test case method.
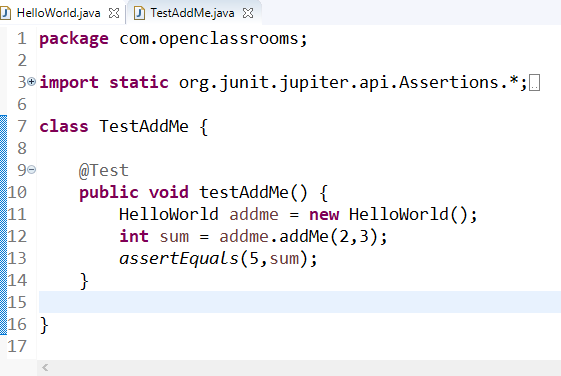
Step 1: Rename your test function according to Java nomenclature. In this case you will call it public void testAddMe().
Step 2: Create a new object for the HelloWorld class to use it's addMe method in the test case. I will call the new object, addme. HelloWorld addme = new HelloWorld();
Step 3: Call the test function using your new object passing in two numbers as parameters and a variable to assign the answer to. int sum = addme.addMe(2,3);
Step 4: The answer to this method call will be 5 because the function will add 2 and 3 as specified in the example in Step 3. We will call the assert function with the parameters assert(expected answer, variable name). It will look like this: assertEquals(5,sum);
Your test case will now look like this:
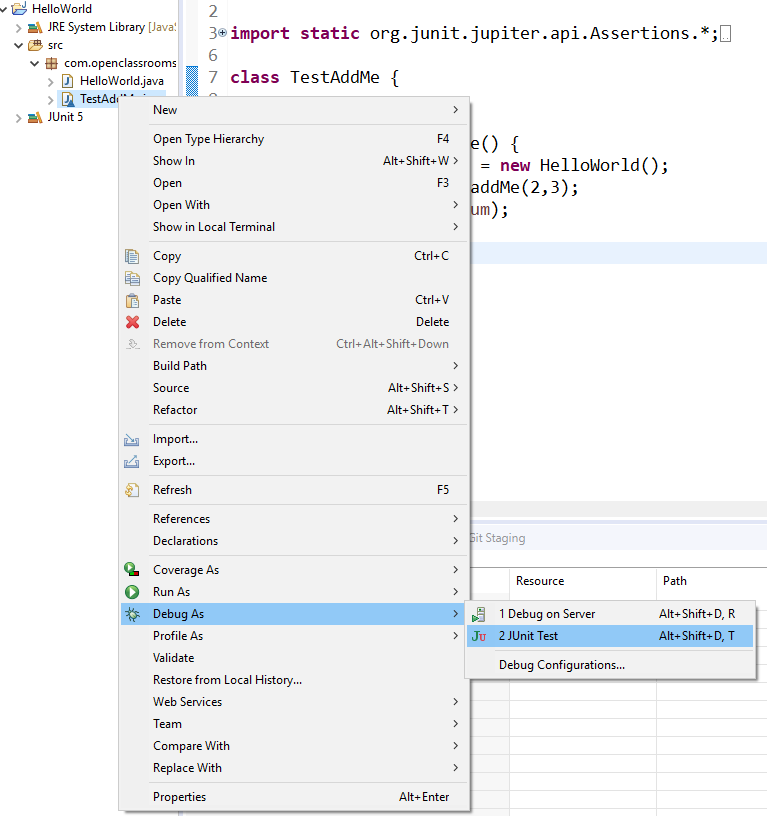
Now let's test the method using JUnit! Right click on your test case file. In this case you will right click on TestAddMe.java. Go to Debug As -> JUnit Test
Your results will show in the JUnit tab in your Explorer:
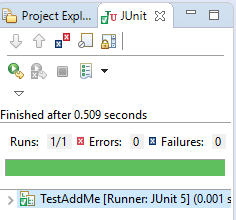
To provide a test execution report, all you have to do is copy what's in the tab in your explorer!
How can I use Git?
Great! You are on your way to becoming a knowledgeable Java developer with the right tools for the real world. Let's now look at code repositories. How can we integrate working with Github on the Eclipse platform? Well, guess what! Eclipse makes that easy too! Check it out in the video below:
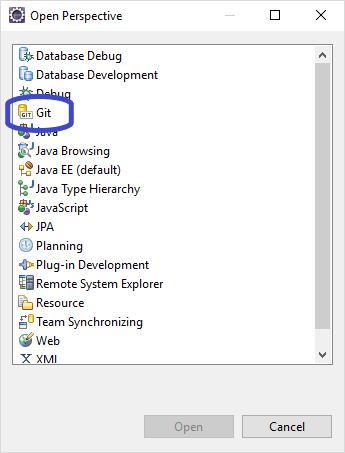
So now that you have the Open Perspective window open, you may see an option called Git, third down. Click on it and open.
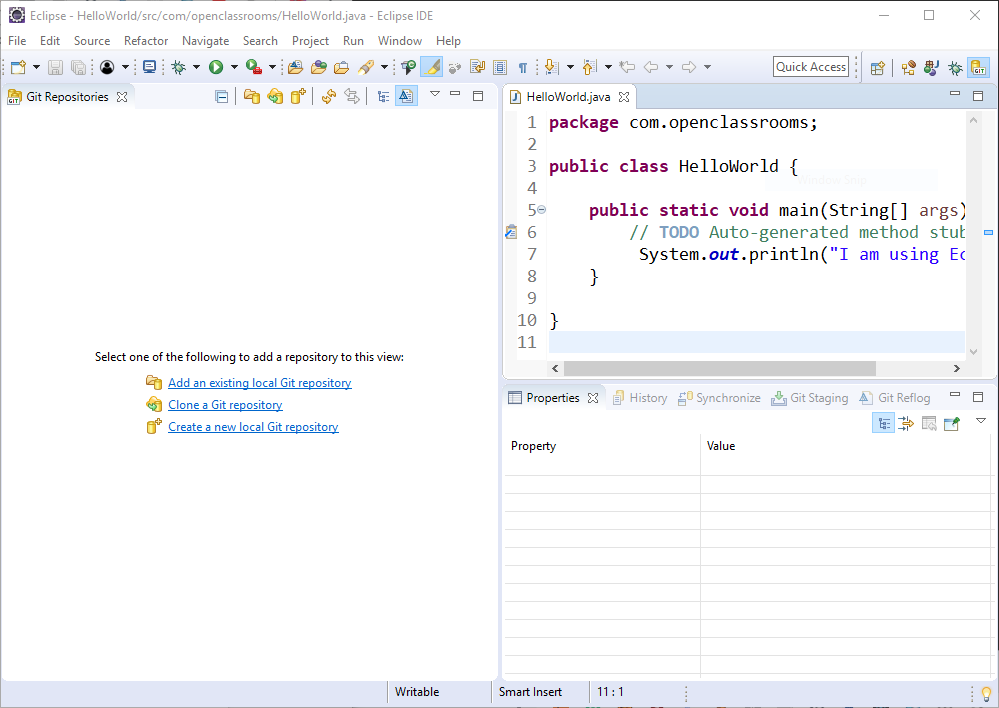
You should now come to a window like the one below. On the left side, the Git plug-in allows you to add a local repository, clone a Git repository, and Create a new local Git repository.
Phew, that's a lot! But now you've got a pretty good idea of just why Eclipse is so useful!
Summary
You should feel able to locate the following elements in your Eclipse interface:
The Package Explorer, Console View, Windows, and Toolbar.
The debugging button, and the elements needed to set breakpoints.
You should also know how to:
Set up a Maven project.
Use JUnit
Set up the Git plug-in.