Work Out Where You Can Use Power BI
Identify Opportunities for Using Power BI
Whether you’re a:
Management controller,
Planning manager,
Project manager,
HR manager,
Or even a consultant…
… one thing’s for certain: we’re all having to work with more and more digital data on a daily basis.
This can be partially explained by:
Management’s increased attention to production costs when needing to squeeze profit margins.
Increased reporting obligations to employees, managers, or investors.
The accelerating pace of company transformation, which requires reliable information about the organization.
However, it’s clear that few training courses prepare people for the issues they might encounter on a daily basis, which tend to be a real headache in Excel…
Let’s take a look at the four most common issues I’ve encountered in my professional practice.
Issue No. 1: Data Reconciliation
“James, could you do an extraction of all the women in the Logistics department who have had a very good or exceptional performance review but who have only had a 1% raise over the past five years? I need it urgently to answer a question from an employee representative who is accusing us of gender discrimination. He says he has several names of injured parties.”
If the thought of receiving this type of request at 5 pm on a Friday evening is making you break out in a cold sweat, you’re in the right place!
This “simple” (but completely legitimate) request would be a truly mammoth task for most HR managers, involving reconciling several databases that don't necessarily work together (performance reviews, payment, organization, etc.). What’s more, most HR managers don’t tend to use any tools other than Excel for carrying out analysis.
In other words, cancel your Friday night plans! 😱
Issue No. 2: Working at Scale
"Ali, we’re considering offering a promotion on our pastries in all of our supermarket bakery sections to boost sales: buy five get one free. Not bad, eh? But we’re not sure what the threshold for the promotion should be. Could you give us the number of pastries bought on average per person over the past month in the U.S.? I don’t want to put any pressure on you, but if you could give us the figures by this evening, that would be perfect.”
Issue No. 3: Cleaning up Your Data
"Mario, this isn’t the first time I’ve asked you for a list of suppliers with whom we place orders worth more than $100,000 each month so that we can renegotiate our contracts and reduce our purchasing costs. Can you explain why I’m still seeing errors in the file you’ve sent over? Do you not know how to use your computer?”
When various colleagues and several departments (Procurement, Logistics, Complaints, etc.) handle data, it’s common to see databases with errors in:
Names (spelling mistakes)
Addresses
Product numbers
Company contact points
And sometimes, some data might even be missing
In cases like this, cleaning up the data might waste huge amounts of time, and it’s hard not to make mistakes when regrouping.
Issue No. 4: Getting the Scope of the Data Under Control (A.K.A “The Classic”)
“Janine from finance told me that your HR figures on company workforce are wrong—they’re not getting the same thing in management control.”
If I had a dollar for every time I’ve heard this one… 😅
There might be several different reasons for this. For example, Finance might not count employees on sabbatical (and are therefore not paid by the company).
Now let’s see how business intelligence has developed to respond to these problems.
What Does Business Intelligence Mean?
Hold on a second—we haven’t been hanging around waiting for business intelligence to arrive to start thinking about these issues in business, have we?
Of course not, you’re absolutely right.
Gathering data to analyze company performance is something that has been practiced as far back as Ancient Greece or Egypt! Luca Pacioli first theorized bookkeeping in 1493.
However, the modern discipline of business intelligence is much more recent.
Let’s take a look at the history of business intelligence.
1950s
Databases were mainly organized in hierarchical form.
E.g., Europe is a continent with X countries. In each country, there are Y banks with Z clients, etc.
This did not allow for the modeling of complex relationships.
E.g., "I have friends, who have friends, who may be friends with each other or with me."
In a case like this, the hierarchy doesn’t work.
1970s
IBM created System R, which allowed for managing and querying large databases using SQL. Relational databases were born. Data is organized by functional domain. Rich and complex modeling is now possible, but queries take a long time.
1990s
E.g., "Show me the total revenue from the bank’s five biggest clients."
Easy to say but hard to work out, because you first need to rank clients and then add them up.
With OLAP, managers finally have tools to help with quick decision-making that are easy to use.
Today
SQL has been replaced by NoSQL databases that allow for quick queries in gigantic databases, commonly known as big data.
This means that BI can be used at all company levels: from the executive (strategic dashboards) right down to business users (monitoring activity).
In addition, it is increasingly rare for information to be stored on servers at the company’s premises. Instead, data is now stored in the cloud, hosted by companies like Microsoft Azure, Amazon Web Services, or Google Cloud Platform. These platforms even include built-in BI and machine learning services within their offering.

Discover Microsoft Power BI
In this course, we’re going to create a dashboard using Power BI.

Like most business intelligence tools, Power BI lets you:
Consolidate different sources and clean up, transform, and aggregate data.
Set key performance indicators (KPIs) that are useful to the company.
Format analyses using visual dashboards.
Share information with different groups of users.
Let’s Recap!
Business intelligence uses data to improve decision-making within organizations.
Microsoft Power BI is better than Excel when you need to reconcile different data files that require formatting.
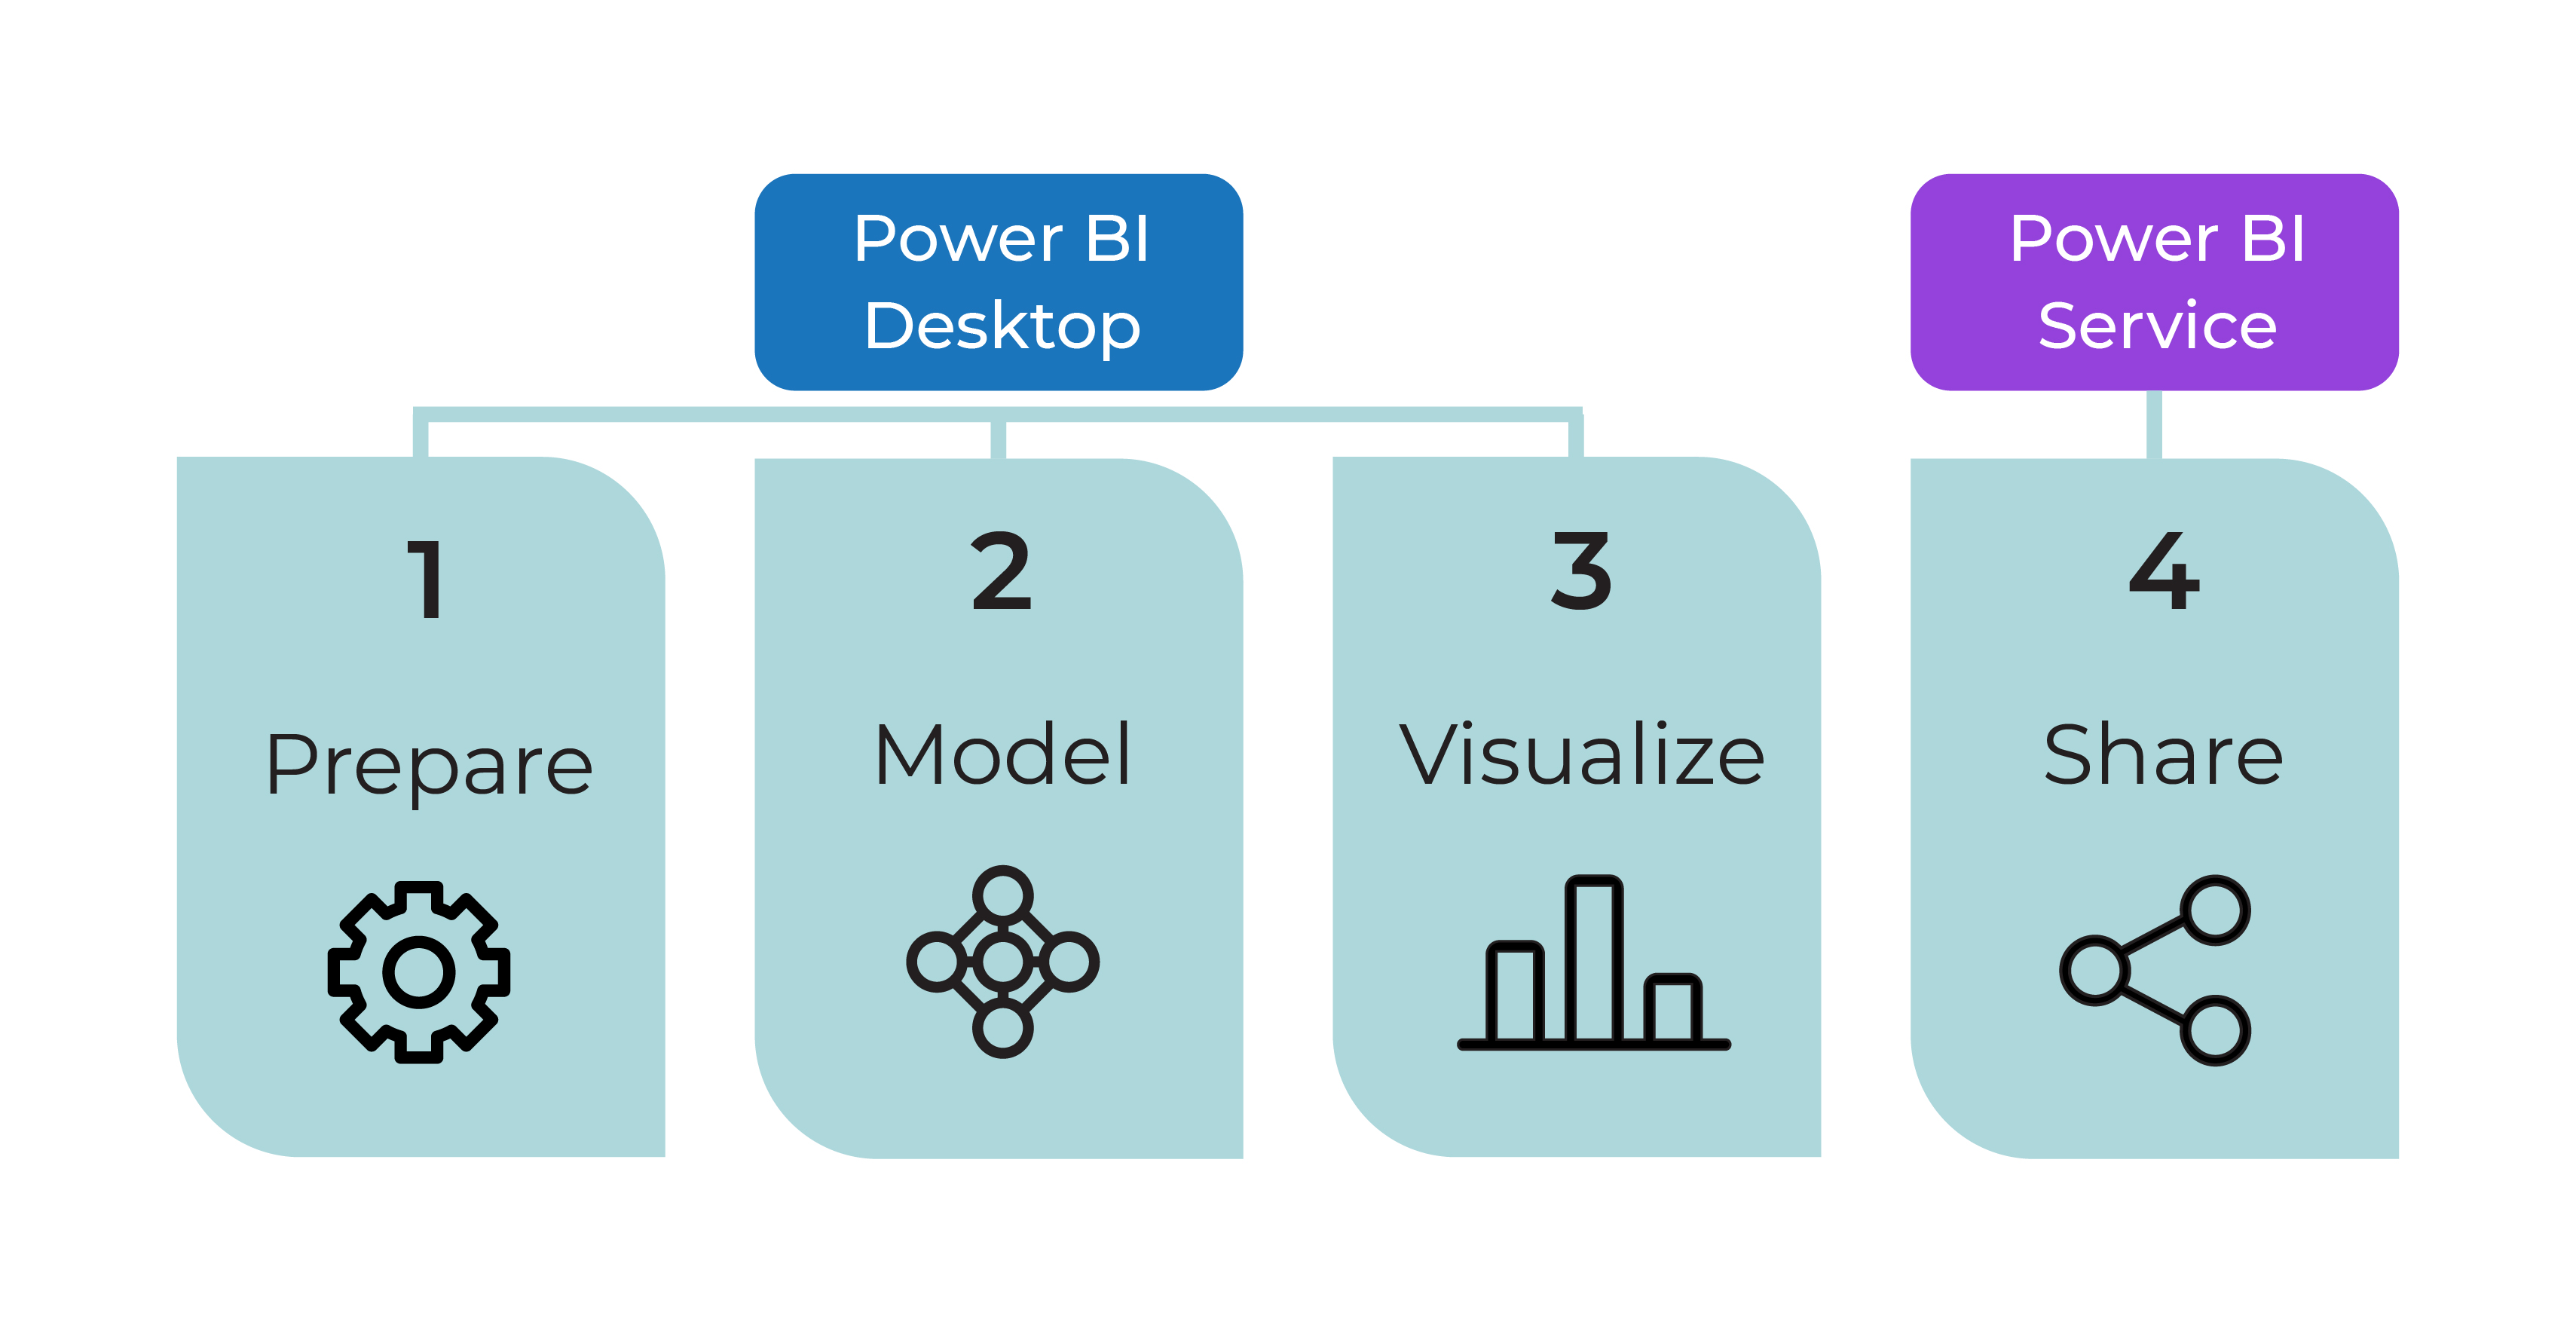
Microsoft Power BI mainly consists of desktop software (Power BI Desktop) and a cloud space (Power BI Service).
In the next chapter, we’ll look at how to gather useful data for creating your dashboard!
