The Timeline tab will allow you to make recordings and see what happens on your page during that recording.
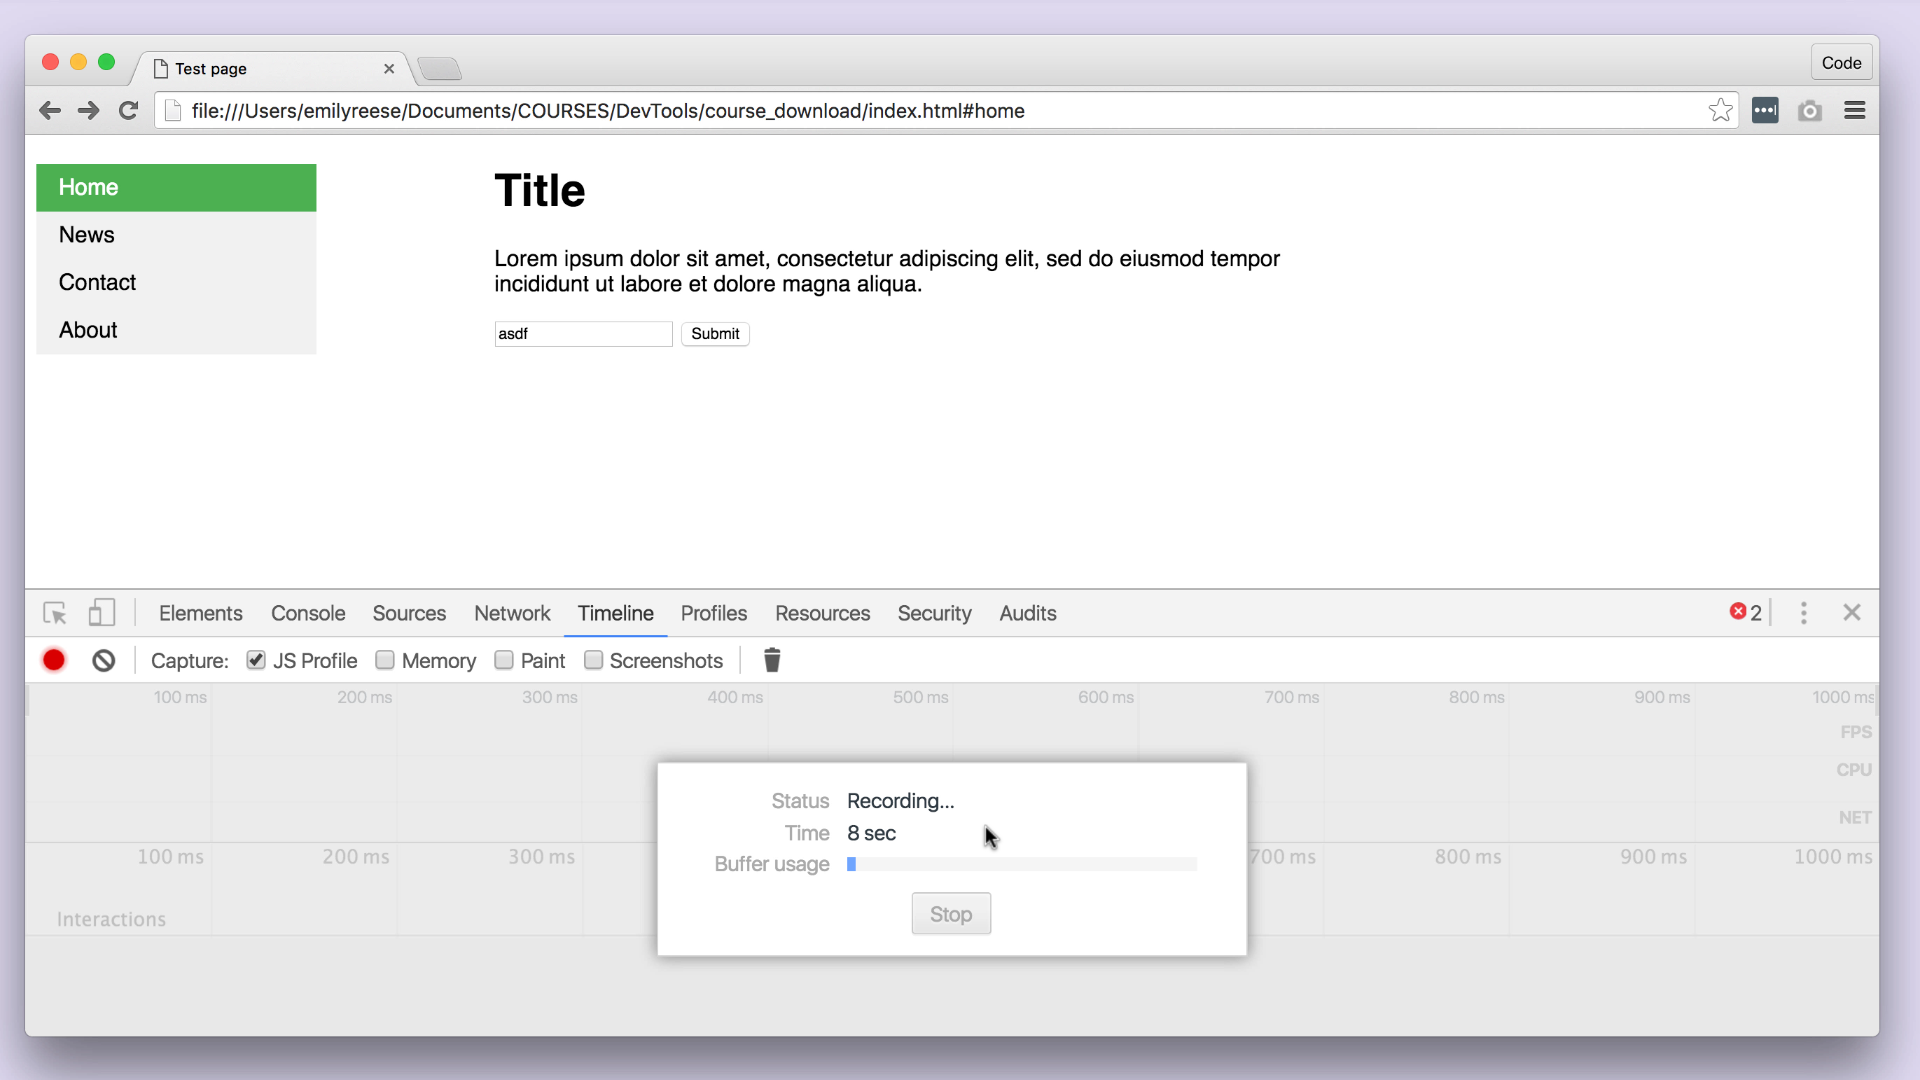
In order to make a recording, click the record button (the black circle to the left) or by typing Cmd+ E (Mac) or Ctrl + E (Windows/Linux). The record page will look similar to a standard recording process, where the button turns red.
You'll then perform the things you want to record on your page, and then hit stop!
Remember you'll get a lot of information back from the timeline recording, so you should keep recordings as short as you can. It's wise to know exactly the actions you want to monitor; that way, you can do them quickly, and avoid superfluous clicks and scrolls that will complicate reading your data.
Screenshots
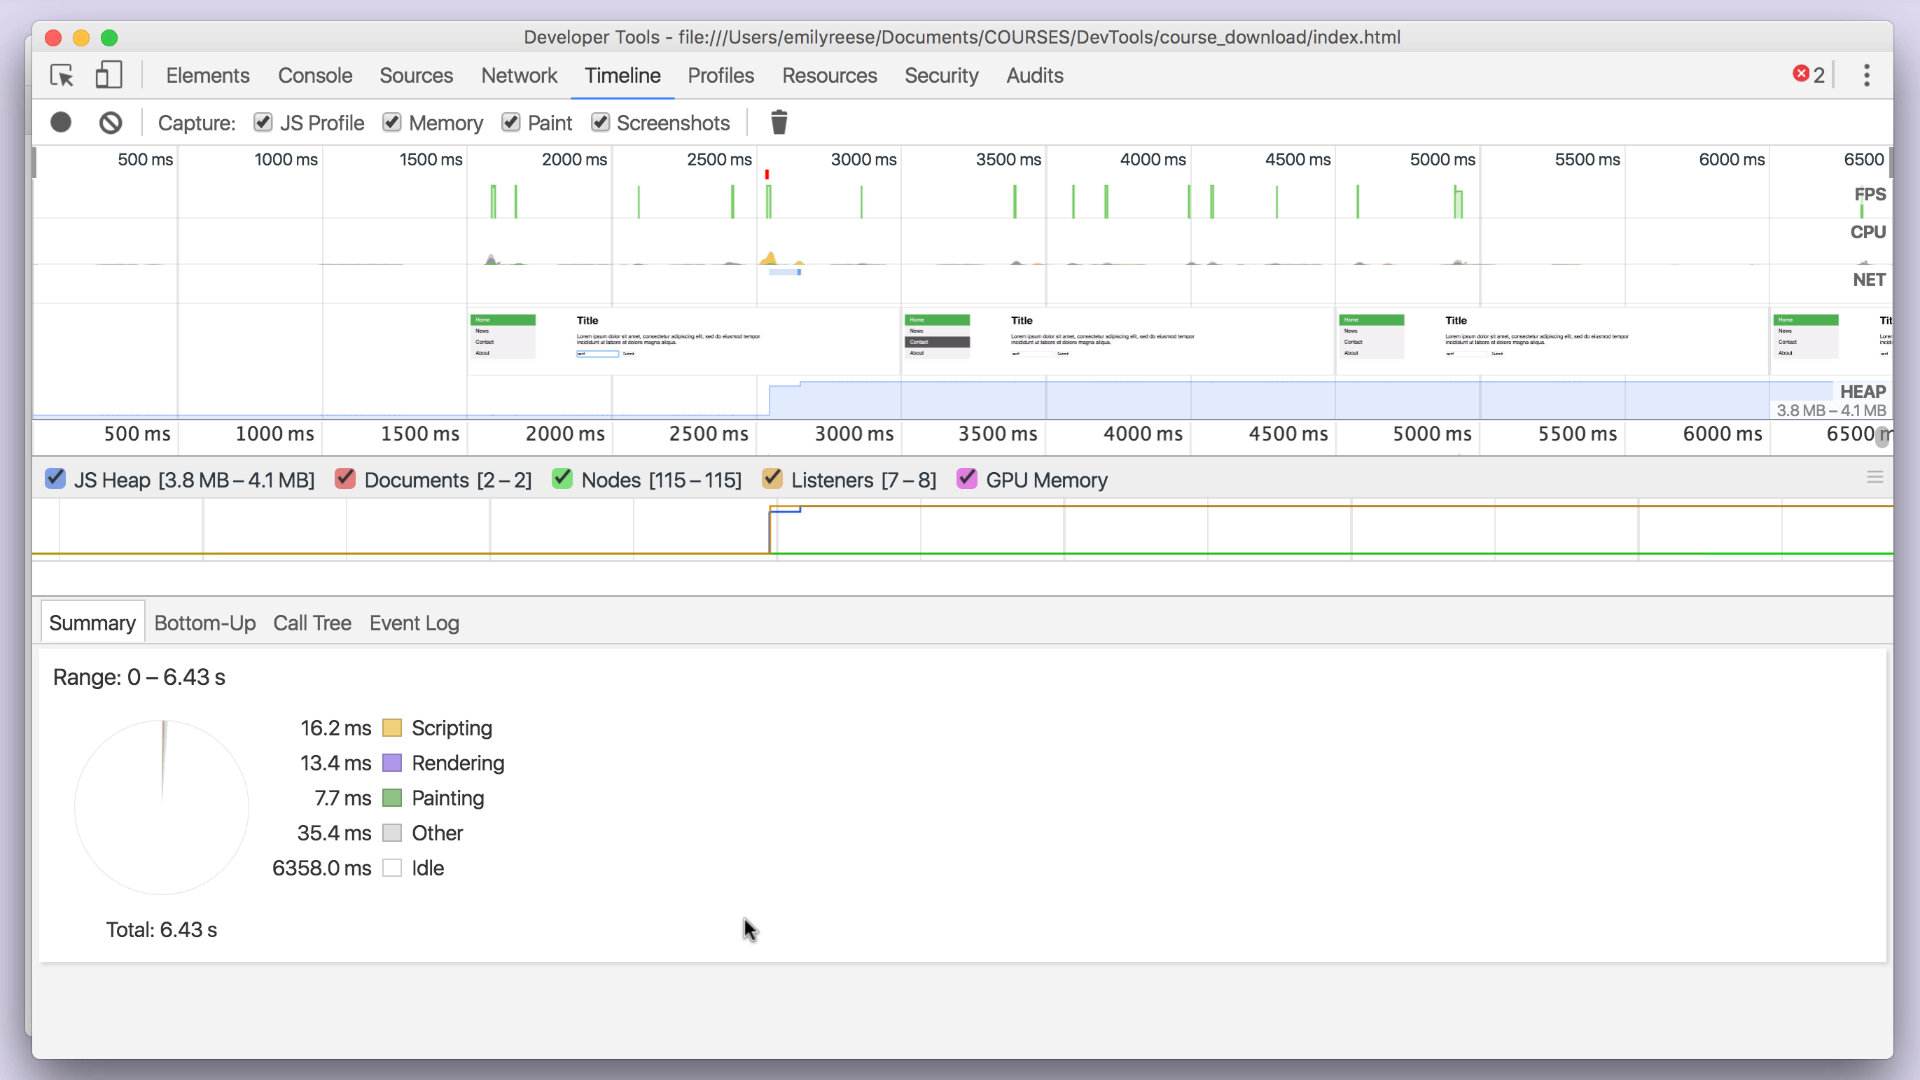
If you check the "Screenshots" box before kicking off your recording, the Timeline tab will take screenshots of your website as the actions happen. Take, for example, the screenshots seen below as I kicked off a recording then clicked on the left links of my test page (which turn dark grey when clicked):
Screenshots are the most obvious check box available to you, but what are the others?
JS Profile: Displays information about JavaScript
Memory: Displays information about the use of the computer's memory
Paint: Displays information about CSS loading
Compare the above example to a screenshot from a Timeline recording of a New York Times page.
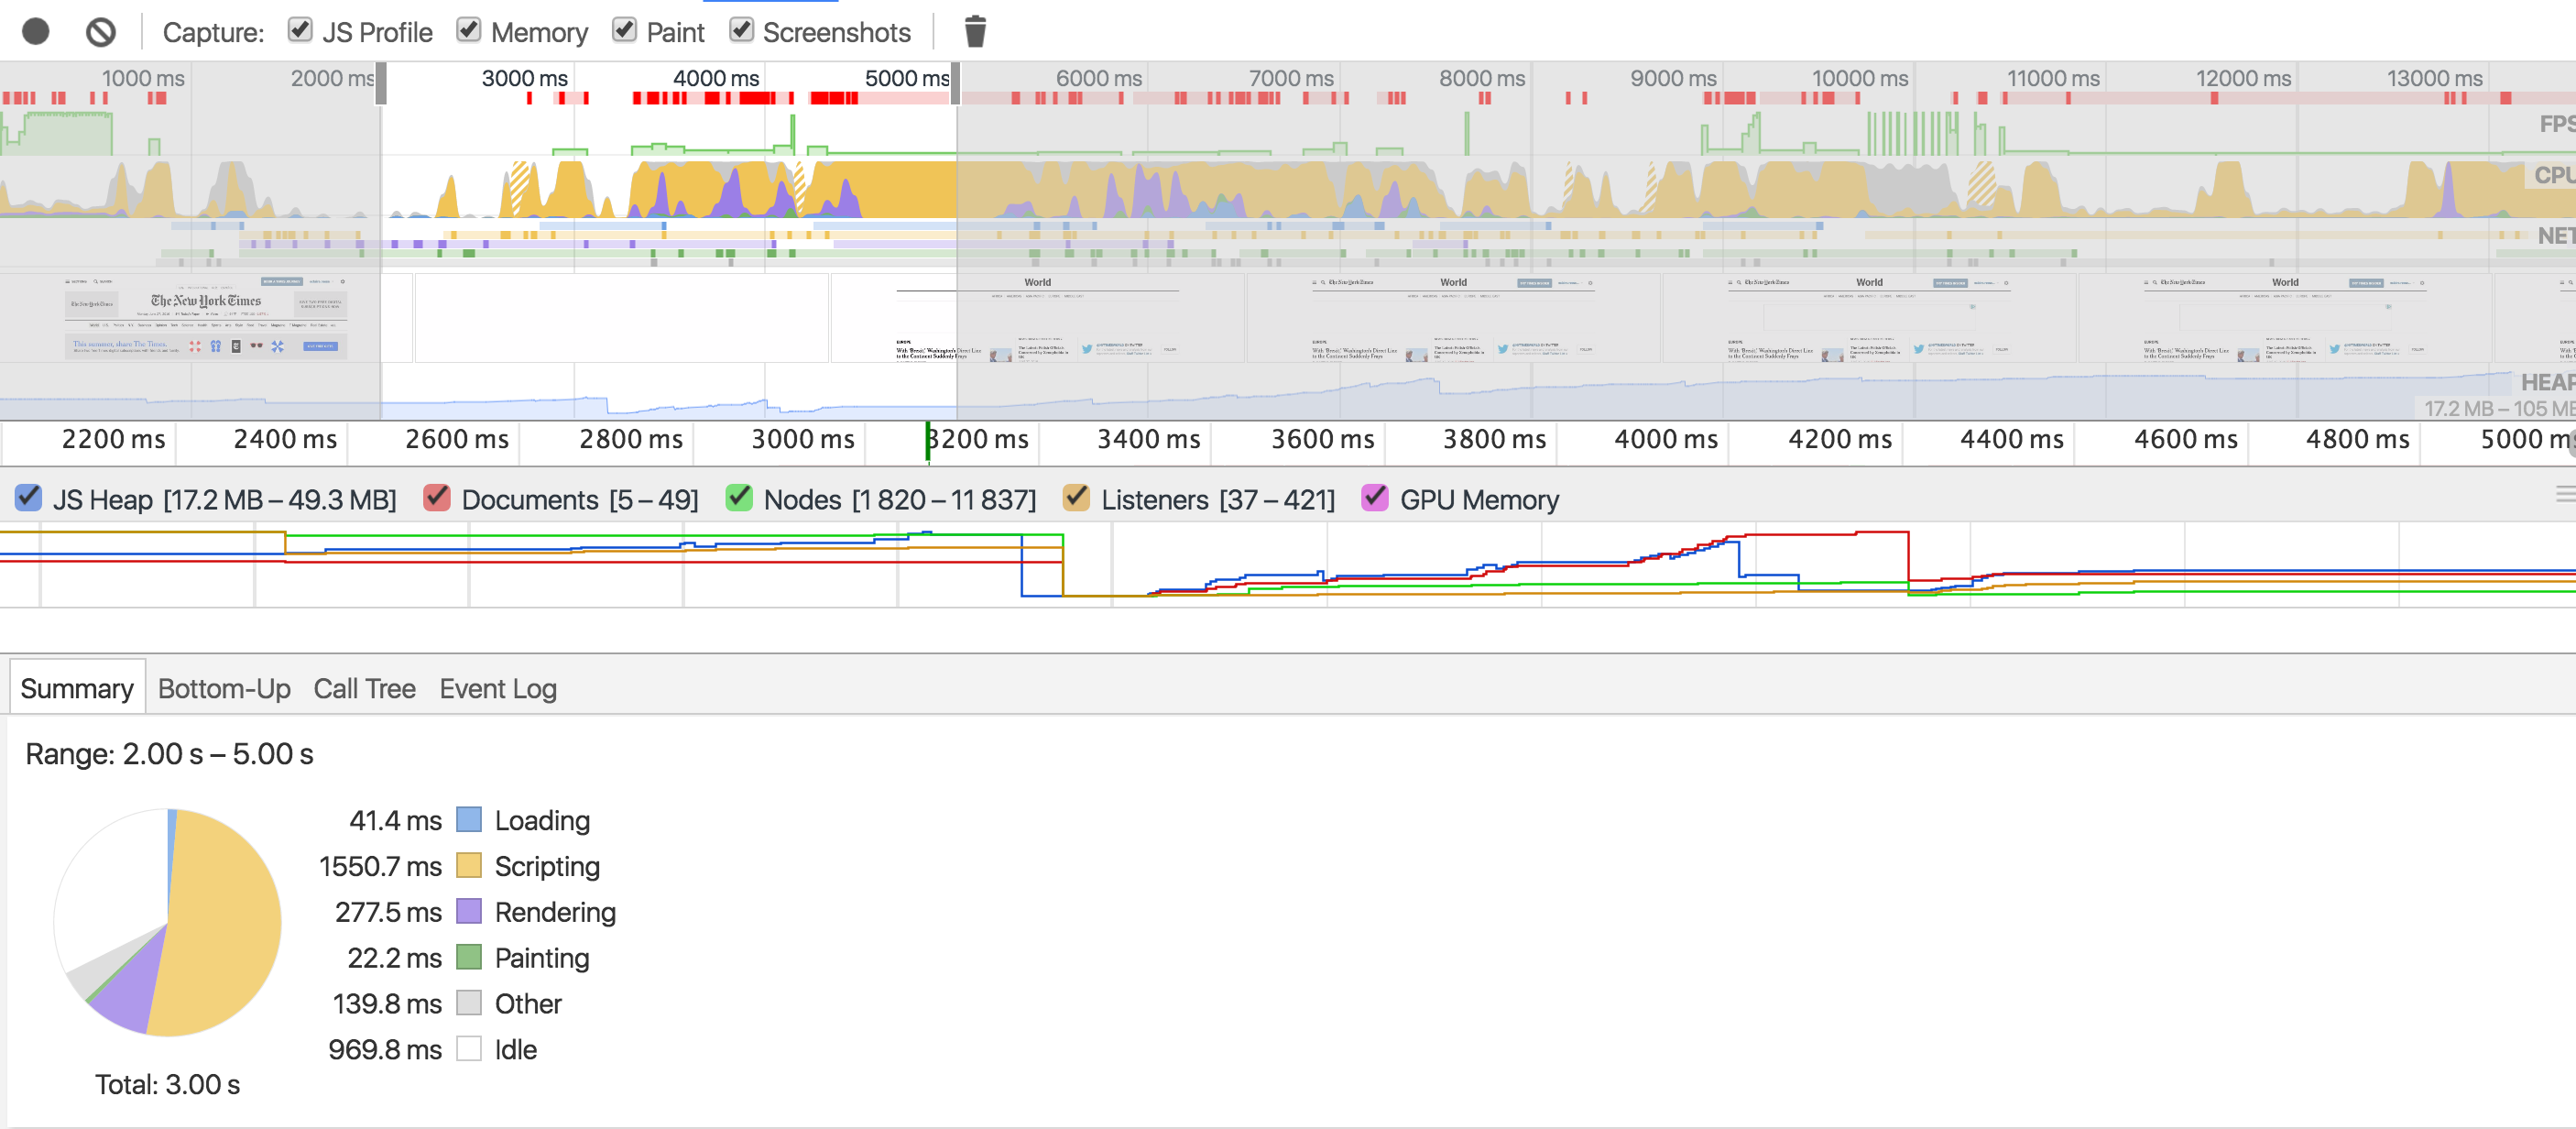
You can see a lot more activity than in the test page! In the pie chart at the bottom, you have more analysis of what happened in the particular segment selected (2-5 seconds).
You'll tend to notice that as you analyze data from the beginning of a request, you see a lot of blue and yellow (loading and scripting). In the middle and towards the end, you have more purple and green (rendering and painting).
Use the Timeline tab if you want to analyze how long different processes are taking to happen on your site!