The Profiles tab is pretty advanced stuff! It lets you measure usage and memory issues in your app.
You can measure 3 different things.
CPU Profiler: Shows JavaScript execution time
Heap Profiler: Shows the distribution of memory for JavaScript objects and DOM nodes
Record Heap Allocations: Shows JavaScript object allocations (this can help you identify memory leaks)!
Here are these three options, laid out in the Profiles tab:
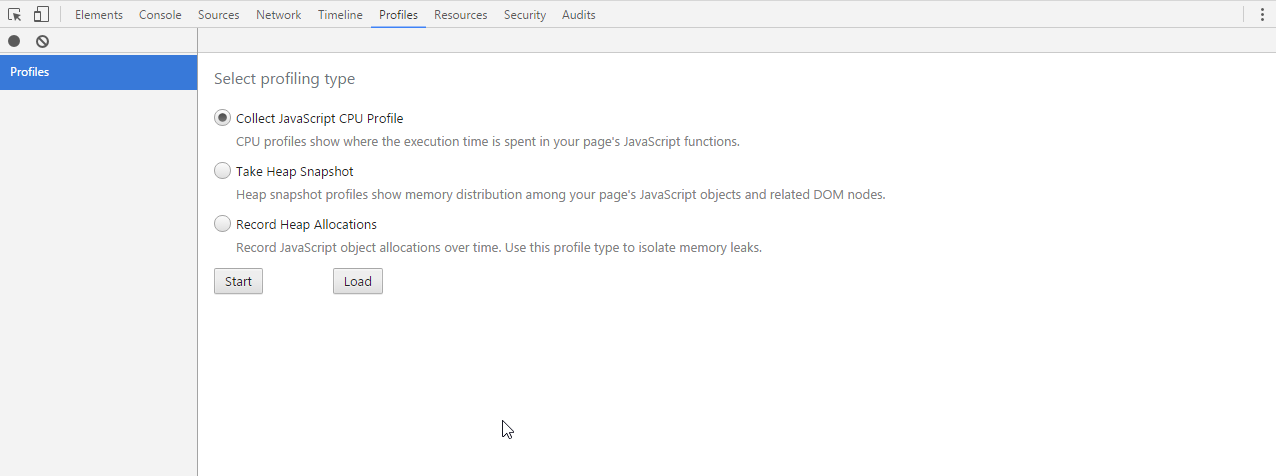
JavaScript CPU Profiler
Obviously, we will see many more results if we analyze a more complicated website such as the New York Times. Let's make a recording of refreshing the page (and we'll try to keep it short to avoid information overload).
Note immediately that you have multiple options to show the data:
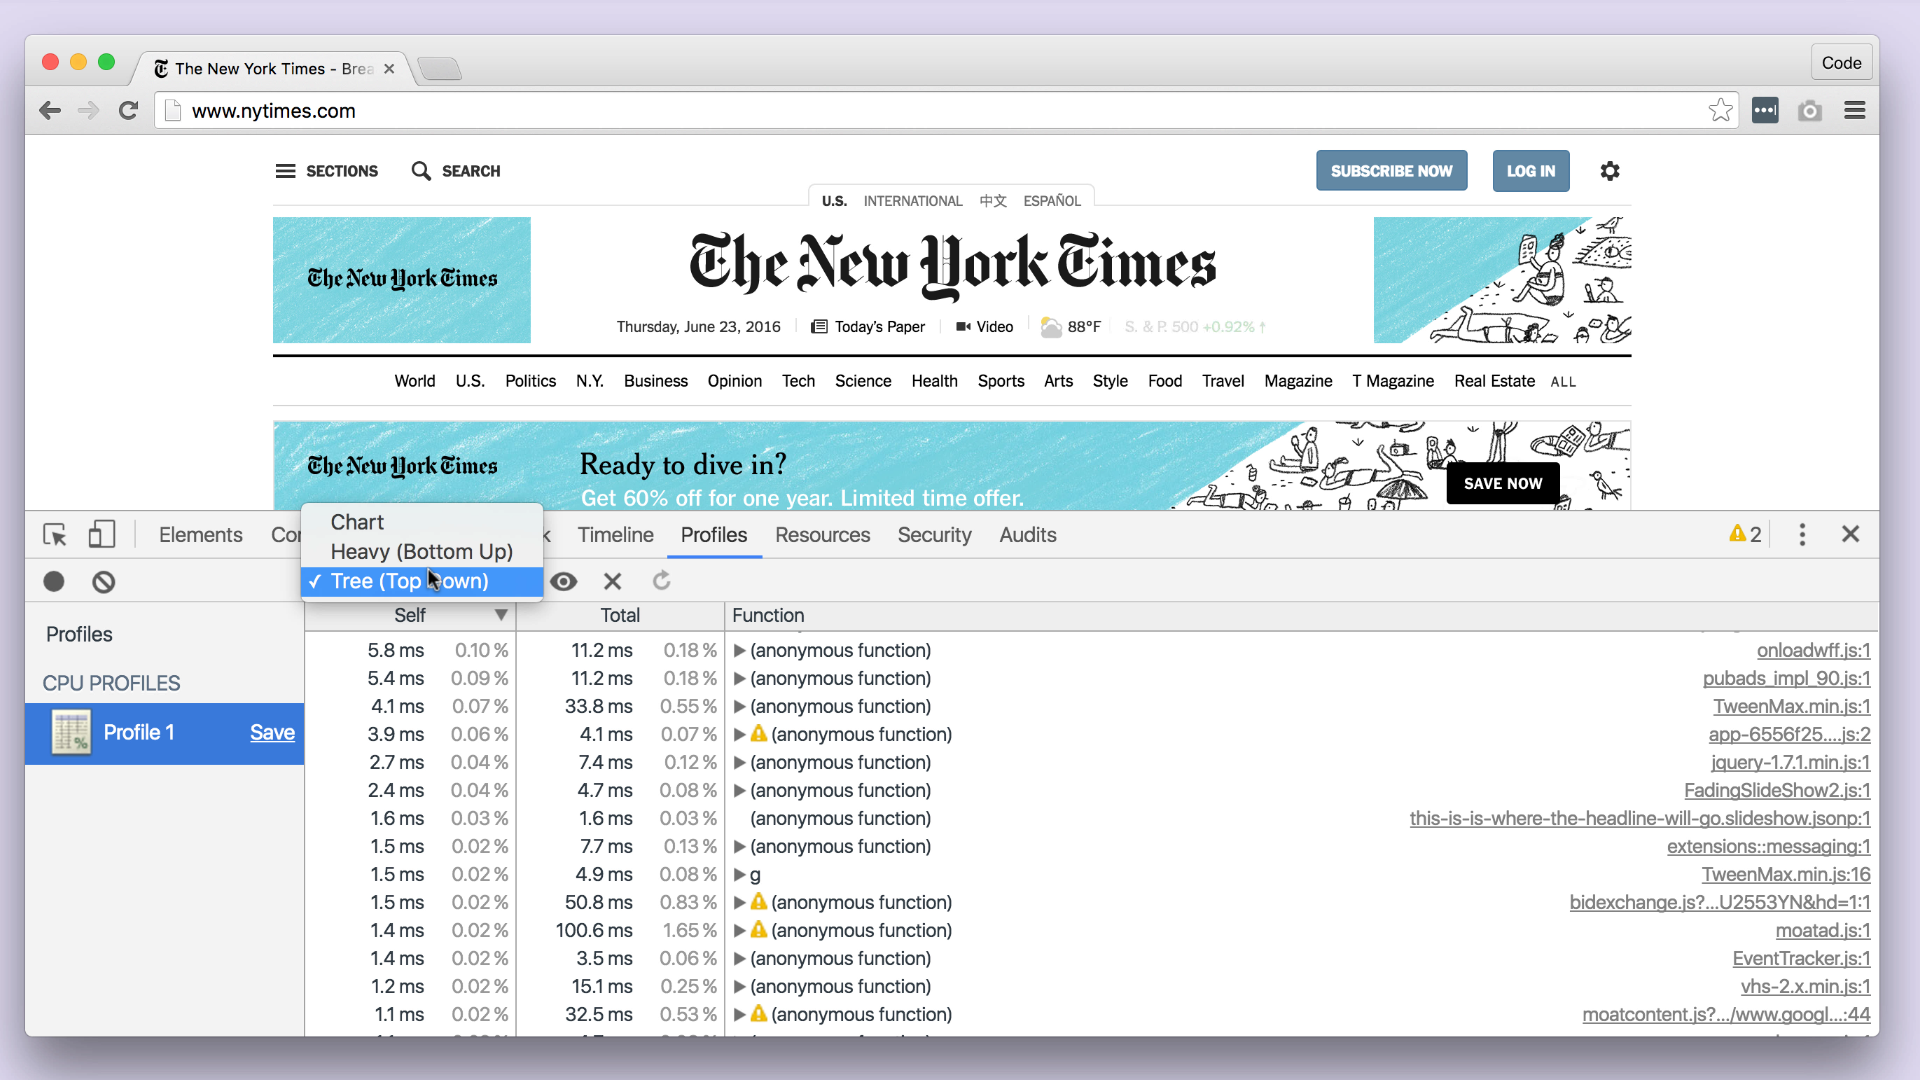
No matter which view option you choose, you'll be able to view the execution time of the page's functions. Each line corresponds to a JavaScript action that was carried out and that consumed processor time. There's only one exception at the top: idle.
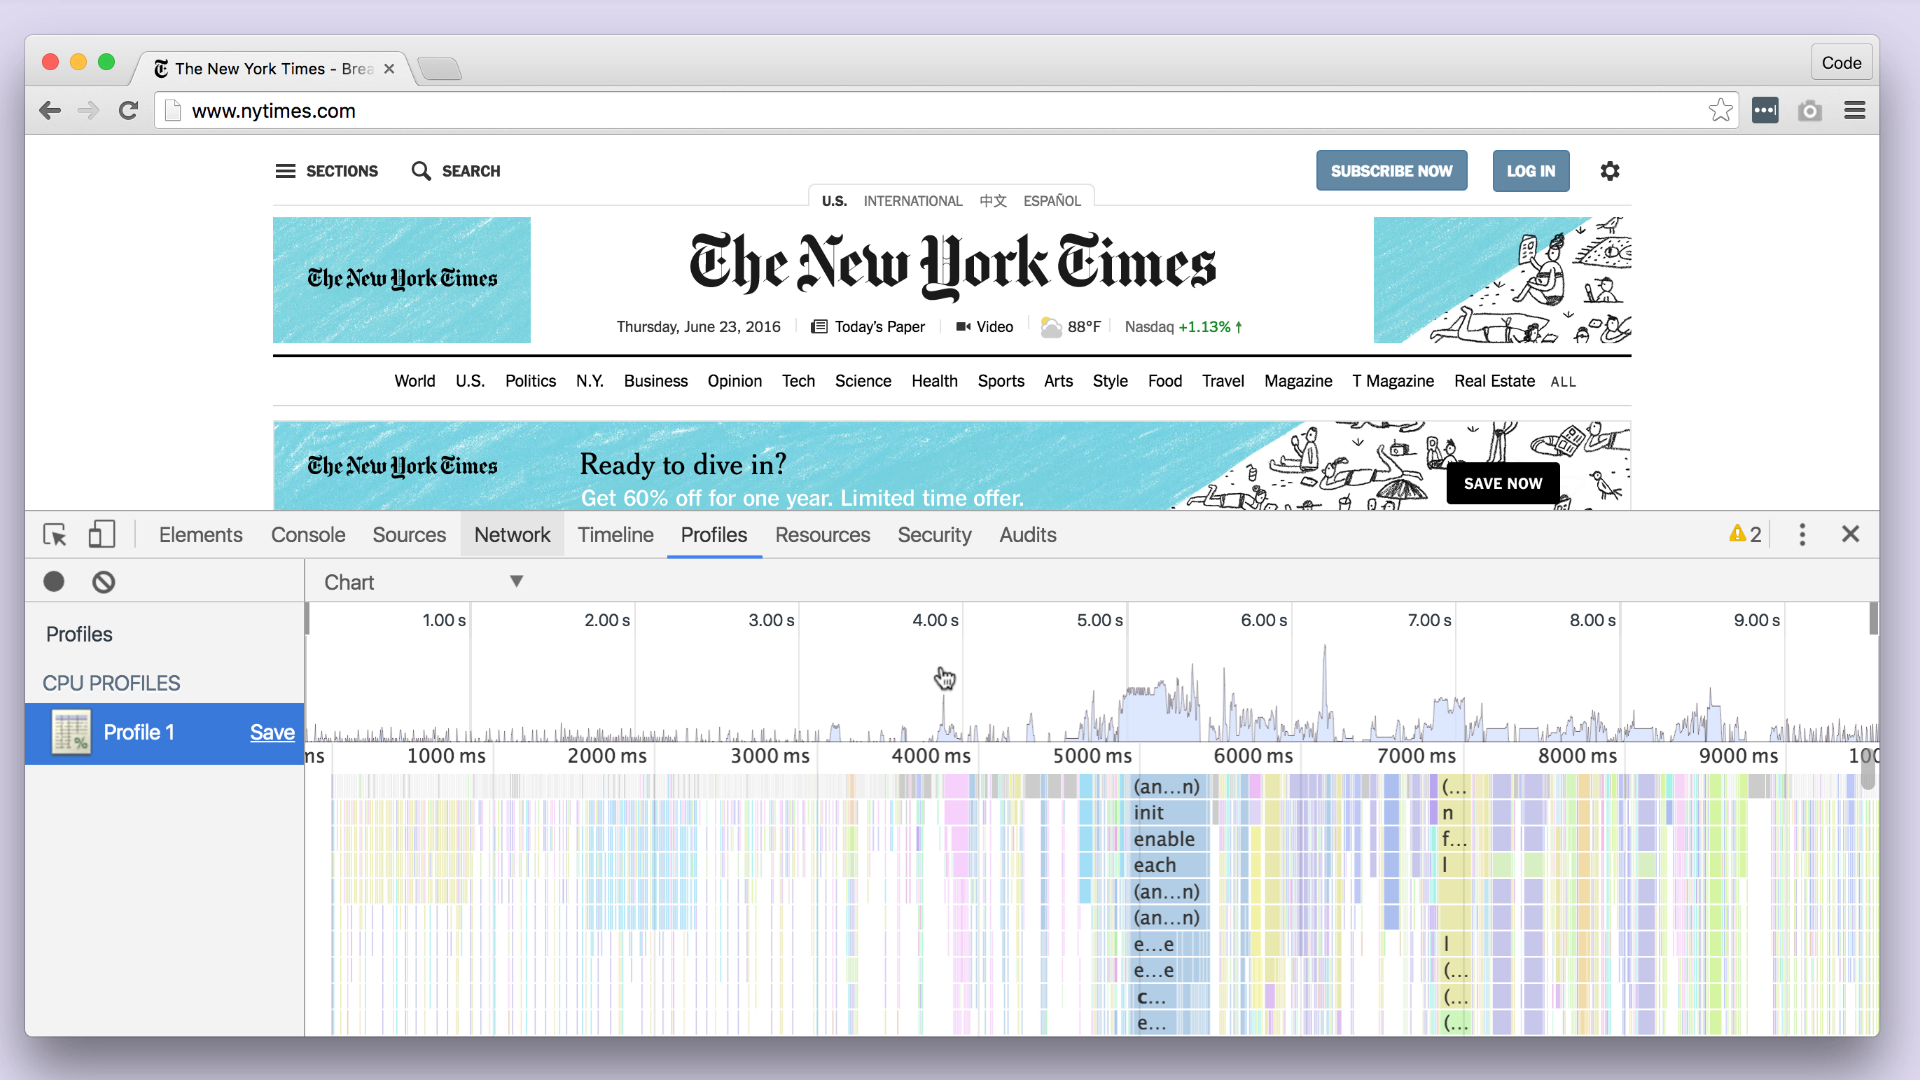
You can save a recording via the "Save" button next to the profile name.
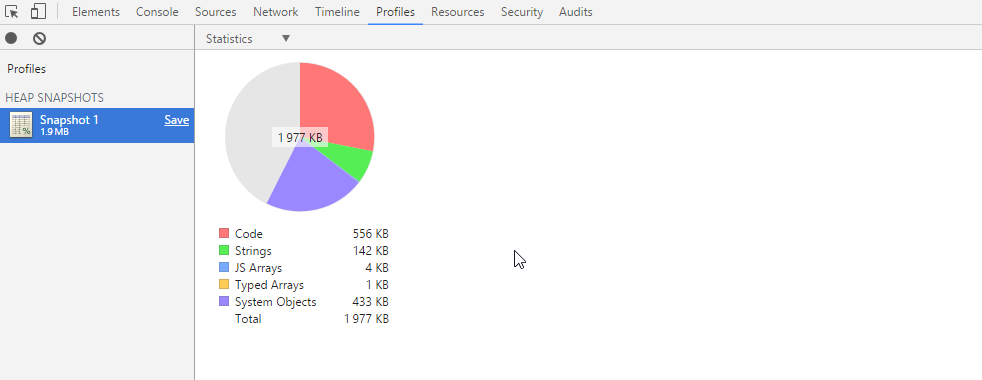
Heap snapshot
Taking a heap profile allow you to understand where memory in the JavaScript heap is used. The result shows you memory distribution of your JavaScript objects, arranged by the constructor function that instantiated them.

There are also several different views here:
Summary: the default display of all objects in memory.
Comparison: if you made two brief profiles, you can compare them here (This feature can be handy if you want to test the difference before/after code changes).
Containment: tree view to see parents and children
Statistics: a graph that represents what type of data takes up memory (in percentage and absolute values)

Containment view
Record Heap
This is a fairly advanced tool that will record memory allocations over the span of a process to identify potential memory leaks.
The recording itself is not complicated to do. As usual, you start recording, perform some actions on the page, and then stop recording.
The views will be almost identical to the heap snapshots, but while a heap profile displays the memory allocated in general, record heap shows memory allocation over a time interval.