Formulate a hypothesis & design an experiment to test it
A Pirate Metrics Example
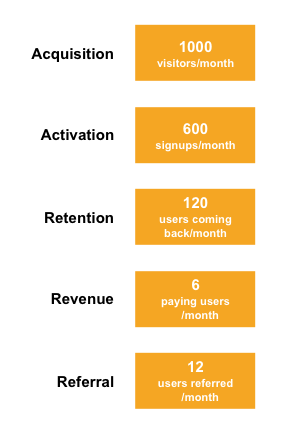
Consider the following scenario. A cool new startup called AmazingCarDeals.com has the following metrics:
AmazingCarDeals is getting 1000 visitors/month to their website (Acquisition)
AmazingCarDeals has a conversion rate of 60% of website visitors that sign up for an account. Therefore 600 users/month create accounts (Activation)
About 20% of AmazingCarDeals users that create accounts log in a second time. This is 20% of 600 users which is 120 users (Retention)
Of these 120 users, only 5% are paying users. AmazingCarDeals has 6 paying users per month. (Revenue)
Of the 600 users that create accounts, around 2% or 12 users refer the product to friends (Referral)
How could you visualize this information using the pirate framework we saw in the last chapter? Categorize the information, then scroll down to see my answer.
Keep going.....
You could visualize the following information like this:
In the last lesson, we looked at how you might prioritize which area of your product or business model needs improvement or validation. Because it is an easy step to understand and get started with, let us take the example of improving the retention rate. The current rate of retention (the number of users who signup who actually come back to the site again) is 20%. We will try to do some experiments to get that rate up.
In order to build something that attempts to generate a higher retention rate than 20%, we need to:
Observe customer interaction with our product
Develop a hypothesis (an unproven theory that would explain how we can improve our retention rate)
Run an experiment (a way to test this hypothesis by changing some things in your product or service to see if those changes achieve a predicted level of improvement)
1. Observe
In this example, we want to improve our retention rate. In order to do so, we need to have a theory of what is lacking or what could be improved; we need to craft a hypothesis of what changes will have the desired level of results. The best way to develop an intelligent hypothesis is to observe what is currently happening.
There are many ways we can observe:
Talk to some of the users involved (either in person, via phone, via Skype or messaging). Tools like intercom provide a great way to live chat to some of the people on your site.
Watch what users do. If you have a physical store, go there for a day and watch customers in the store. If you have an online product, then you can use heat maps or screen recording software to see where people are clicking and how long they are spending on each part of the page.
Talk to your support team. If something is terribly wrong, you will get (some) customers who complain. Fixing what is deficient is just as valid an option as improving something that works well.
Look at your metrics. If you have certain flows that customers naturally go through in your product or website, is there a huge dropoff at one particular part of that flow? If so, you can identify exactly where customers are having a negative experience and you can zoom in to examine that part of your product and think of improvements.
2. Develop a hypothesis
A hypothesis is:
a supposition or proposed explanation made on the basis of limited evidence as a starting point for further investigation.
From the "limited evidence" of your observations in the previous step, you want to put forward a theory for what explains our current retention rate being lower than it could be, as well as some suggestions for what would increase it.
In order to be a scientific hypothesis, the scientific method requires us to be able to test the hypothesis. In fact, scientific hypotheses should:
Explain what you think will happen in the future
Be understandable
Be testable
Be measurable
An example of an hypothesis for increasing retention could be "Customers feel some anxiety about whether is safe to buy a car on our site. If we explain that we insure all transactions against fraud, there would be an increase in customers returning to our site".
3. Run an experiment
In order to run an experiment, first we have to design it and then follow the Build-Measure-Learn approach
We build what is necessary for the experiment, measure results, and learn if this experiment proves our hypothesis to be true or false.
Designing Experiments
Our goal when designing an experiment is to:
Prove (or disprove) our hypothesis
Do so with a fixed timeframe (e.g. one week)
Do the least amount of work to achieve the proof (or refutation) we require
State what actions you will do (e.g. send a new email to 100 newly signed-up users)
State the expected result for success (e.g. retention will go up 5%)
We previously mentioned the concept of "velocity of learning". This explains why we want to look at what we build as being the minimum necessary to get the results we seek. Learning about minimum viable products and reading the many examples of those previously seen in the lesson will now stand us in good stead because they are good examples of being the least amount of work needed to achieve the learning we desire.
For the AmazingCarDeals.com example, lets turn our hypothesis into an experiment
Our hypothesis was:
Customers feel some anxiety about whether is safe to buy a car on our site. If we explain that we insure all transactions against fraud, there would be an increase in signed up customers that return to our site.
An experiment for the following could be:
We will send an additional email to 100 new customers who have signed up in the last three days. The email will explain our insurance policy and offer a button which will bring customers back to our site.
We expect 10% of users to click on this button and half of those (5% of those who get the email) to log in.
Build-Measure-Learn
The experiment above requires sending an email. Depending on the email service you use, it may just be a couple of hours of creating a nice email template and then sending to a list of email addresses.
For this experiment, you would need
An email template
A list of people to send it to (recent signups)
A way to measure the success of the emails
Many email services will give you metrics around the user response to your sent email. For an experiment like this, a tool like Intercom would do the job very well. In that case, you would build an email template and your implementation would look like this:
Create the new email template explaining that all transactions are covered by insurance
Send this email using a service like Intercom where 'signed up date' is in the last 7 days (or another number of days that will mean that the target number of users receive the email)
Measure opens, click-throughs and whether customers logged-in again using Intercom
If the number of logins is greater than 5% then we have learned that explaining the insurance policy via email (in our example) does prove that greater awareness of the insurance policy improves retention. Now that we have proven this, we should consider whether every user from now on should receive this email (and make this change part of the product rather than just a small scale experiment).
Summary
Formulating a hypothesis means trying to explain what is happening in the real world and why.
We need to first observe what is going on. Then we can come up with an idea for what will happen in the future if we change (improve) something. Then we run an experiment to get data to see if we were right - did what we expect happen?
Resources
Elements of a good hypothesis
