Decide which metrics to collect
One metric isn't going to tell you what to do. There's no one-size-fits-all-metric. Every product is different, serves different uses, and has different purposes. Therefore, every product should have different ways to measure success.
Know your goals
Metrics are a standard of measure or evaluation. The first step in defining metrics is to have clearly defined goals, KPIs (Key Performance Indicators), and measurements for success. These typically come from leadership, but you may have them for your own department as well. (We covered these topics in more detail in the course Manage creative projects). Also, what you're measuring may depend on what stage the business is—early stage start-up or late-stage well-established company.
KPIs are performance measurements that help companies determine if they have met their business, financial, sales, or marketing goals. KPIs in the product world could include the number of users, the amount of money the average user spent, or sales by region or demographic.
Knowing your business goals can help determine which metrics are most important to you. If you want new users to visit your site you may consider how many times someone visited your site before signing up, what path they used to sign up (was it a free trial or a webinar that was the real incentive?), or which page people visited before finally hitting the "join" button.
SMART goals can be helpful for considering goals and KPIs.
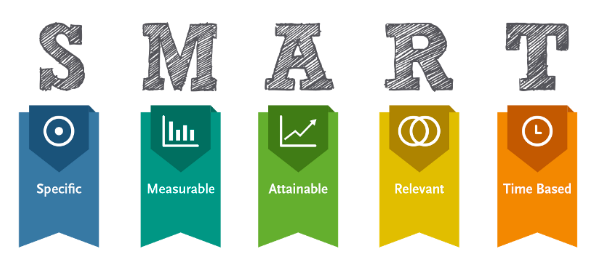
Specific: Don't let your goal be open to interpretation.
Measurable: Measurement allows you to track progress.
Attainable: While challenging yourself is a good thing, make sure it is possible to accomplish your goals. If you're too ambitious and don't think you can attain the goal, you may not commit.
Relevant: Your goal should be related to your product and have an impact on what you're trying to achieve.
Time-based: there should be a deadline for your goal. If it's an open-ended period, you won't be able to measure whether or not you achieved your goal.
Knowing your goals is essential when determining the metrics you want to examine and the analytics you want to record. Without goals, you risk getting lost in the sea of endless available data thanks to digital services. It is crucial that you have a way of measuring whether or not you have achieved your goals.
Use the HEART framework
Google's HEART framework for user experience is a useful way to examine which metrics you want to capture to support the development of your product. The HEART categories allow teams to think about how they can define specific user-centered metrics that will help track progress towards goals:
Happiness – subjective aspects of the user experience, overall attitudes, and satisfaction
(Best tracked with well-designed surveys)Engagement – user's level of involvement with the product, including the frequency, intensity, or depth of interaction
(Best tracked as an average per user, such as the number of photos uploaded per person per day)Adoption – the number of new users over a given time, or users who start using a given feature over that time
(Best tracked by considering something like the number of accounts created in a seven-day period, or number of users who use a feature in a time frame which is considered regular)
Retention – rate at which existing users return (conversely churn is used to describe the number of customers who leave during a defined time period)
(Best tracked as the number of users who stay active over time, or repeat defined actions)
Task success – behavioral metrics including effectiveness, efficiency, task completion time, and overall task success rates
(Best tracked as time to complete a task, or accuracy in completing a task)
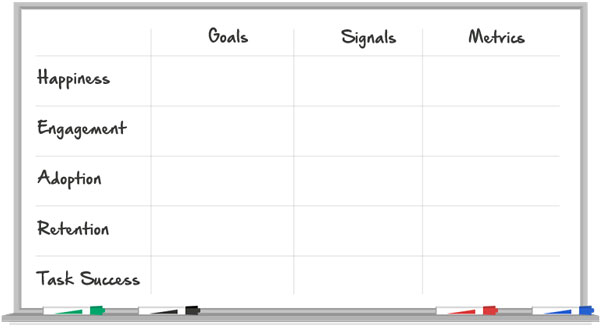
HEART framework chart visualization by Digital Telepathy.
For each category, look at the HEART framework in terms of Goals, Signals, and Metrics in relation to the product you are working on which help define the metrics most useful for your needs.
Goals in this context are from the perspective of the user experience. Consider what the user needs or wants to accomplish or achieve. Different team members may not always agree on what the goals are, so it's important to have this discussion. You may want to consider what success may mean for the project or feature, rather than the entire product as a whole. Discussing goals can help ensure all team members are on the same page regarding the goals for a project. Working towards goals can also be highly motivating.
Signals help you consider how success or failure of the goals may manifest in user behavior or attitudes. You will map your goals to signals. Consider actions, feelings, or perceptions that would indicate goal achievement. Signals should be specific to a goal, and only move when the user experience is improved or made worse.
Goals and signals are refined into metrics and tracked over time. Signals can be tracked in many different ways. Determine which metrics best support your goals and document them in the final row of your chart.
Depending on the product, every category in the HEART framework may not be relevant. To be effective, you are not required to fill in the entire chart. In fact, start with one or two categories that you find most relevant. Use the framework as a tool to determine what is meaningful for a particular project. The framework will help you prioritize your metrics as well, which should always be according to your top goals. Having a few key metrics that are relevant and that everyone cares about is crucial to the success of a project. Your metrics should also reflect the quality of your user experience.
Find the narrative in numbers
Kate Rutter has become an advocate for meaningful metrics. At the UX Conference London (2018) she gave a talk entitled Finding the Narrative in Numbers: Making the Most of Metrics. She addresses how metrics can be explored through words, pictures, and numbers to have a more complete view of users' actions. In the talk she asks, "What can our customer do with our product that they can't do without it?"
Finding the Narrative in Numbers: Making the Most of Metrics is a highly informative, and amusing look at metrics, which is well worth the 44:38 min to watch. You can find an audience member's notes of the slides and talk online.
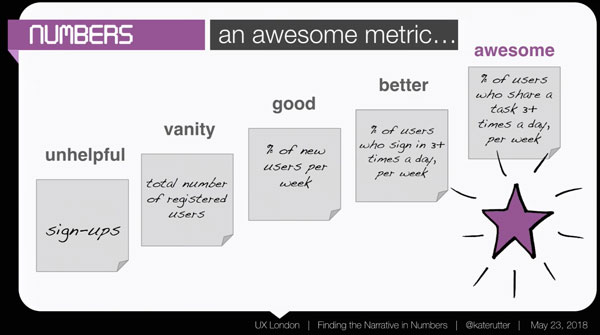
In her talk, Kate Rutter breaks down metrics showing how to make them more useful for understanding the behavior of users:
Unhelpful metric: sign-ups
Vanity metric: total number of registered users
Good metric: percentage of new users per week
Better metric: percentage of users who sign in 3+ times a day per week
Awesome metrics: percentage of users who share a task 3+ times a day, per week
Moving from an unhelpful metric to an excellent one takes a bit of work. Ask a lot of questions and consider the user in order to determine information that can help build a better product. Excellent metrics take refining over time.
Just for fun, here are the sketch notes from her talk. (We explored sketch notes in the course Communicating your ideas through design and storytelling.)
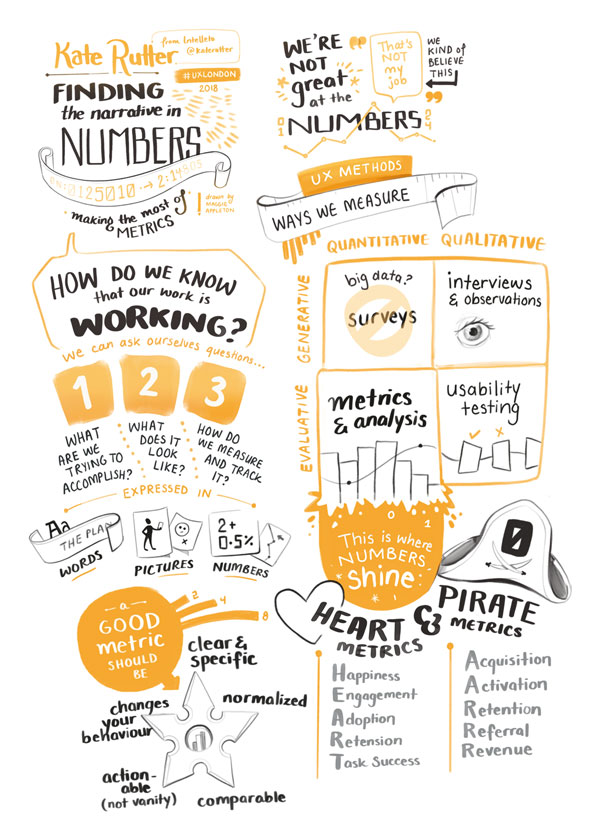
Maggie Appleton's sketch notes from Kate Rutter's 2018 UX London talk.
Draw a line in the sand
Sometimes when you're starting a new project, you may not know as much as you'd like about your users and their behaviors. Your metrics are bound to change over time. In the book Lean Analytics, the authors address this moving target in terms of "drawing a line in the sand" rather than carving these numbers in stone. You can make adjustments to your metrics as you gain more insights into user behaviors in relation to your business goals.
To start, create a hypothesis with the knowledge that you don't have a perfect understanding of the metrics you need to be collecting. As more data comes in, you can compare it to your hypothesis. As a designer, it is in your nature to question things. As you see the numbers unfold, keep asking if these are the best metrics to capture the user experience.
In Lean Analytics, the authors present a case study for HighScore House, an app to encourage children to do their chores. When starting out, the company defined an active user when both parents and kids each used the app four times a week. When this wasn't happening, the team made adjustments to the sign-up flow, sent daily notification reminders, and transactional emails to parents that were based on the actions the kids took.
None of these changes provided a significant improvement in reaching the goal of using the app four times a week. It wasn't until the CEO picked up the phone and talked to parents who had signed up but weren't "active enough" that they started to understand user behavior better. The parents he talked to were surprisingly pleased with the app—it just turned out they only needed to use it once or twice a week to get value out of the product.
Let's recap!
Every project is going to have unique metrics.
Clearly defined goals will be a guiding force throughout your project.
The HEART framework is a good approach for helping you determine your key metrics.
You may need to adjust metrics over time as you better understand your customers.
