Carry Out Data Cleaning Tasks in Tableau
The time has come to clean our data, woot! ^^ So where do we start?
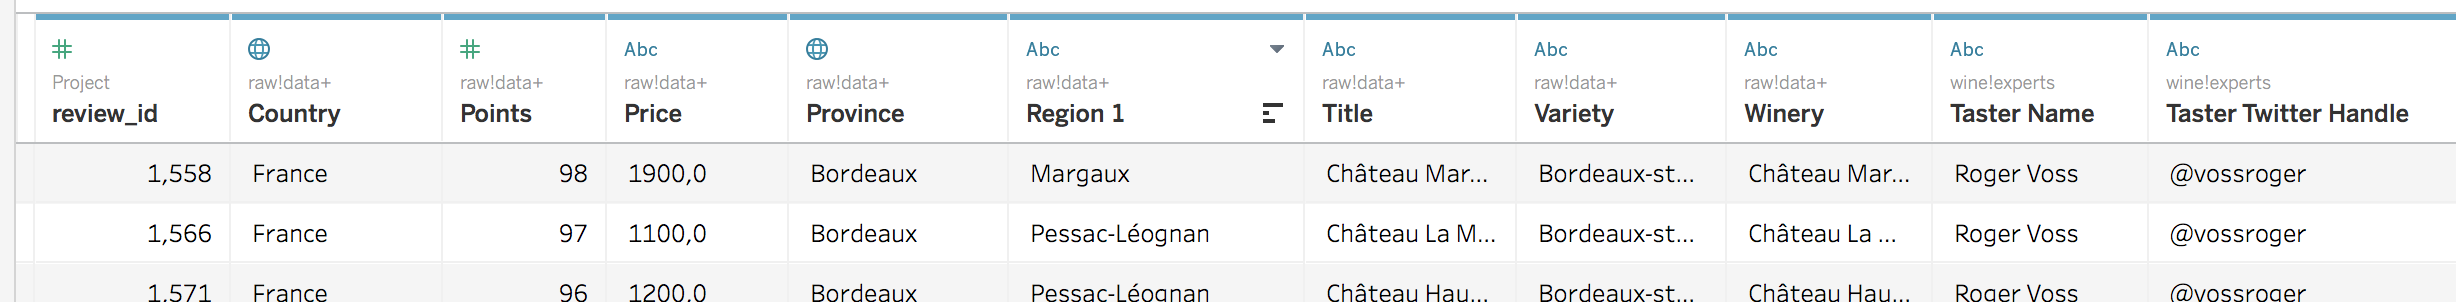
First, I would like you to go ahead and navigate to Section E, or the data preview area of the Data Source Page. Remember from the last chapter that this is the area where you can review some of the rows of the dataset you are loading into the Tableau Workbook.
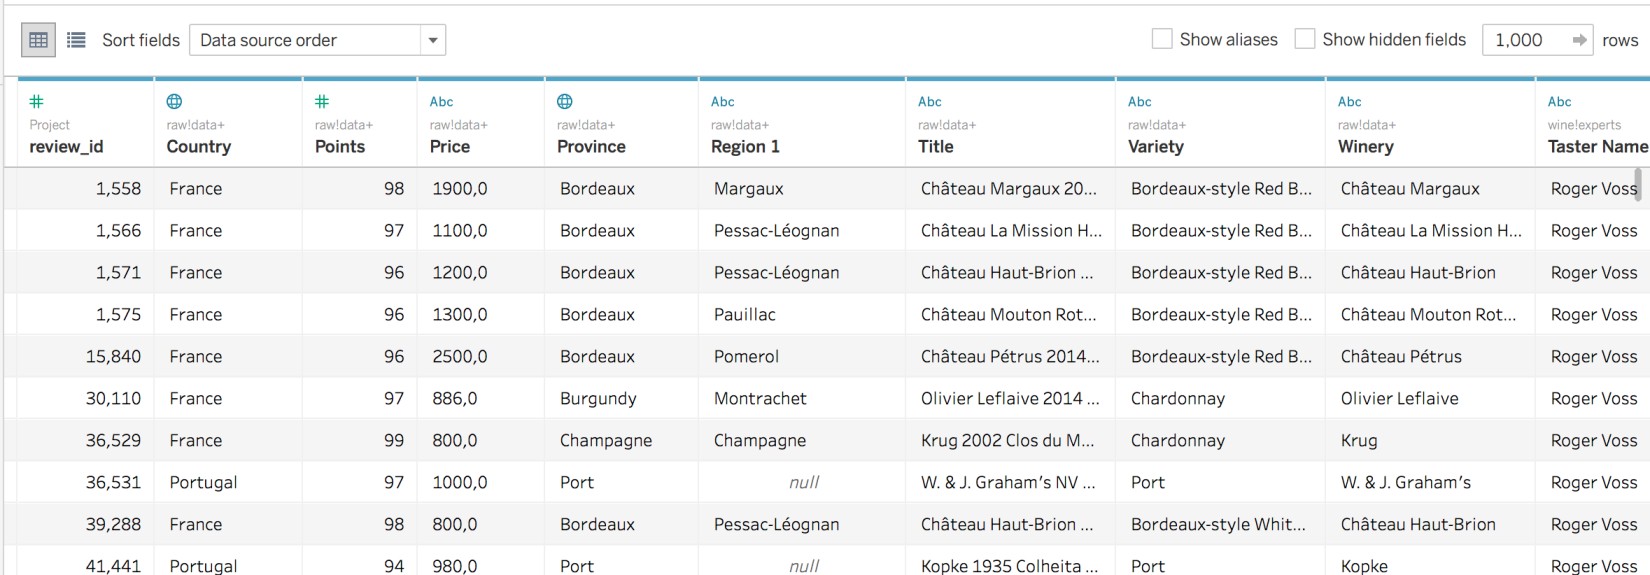
Remember, the default is to show the first 1000 rows of the data.
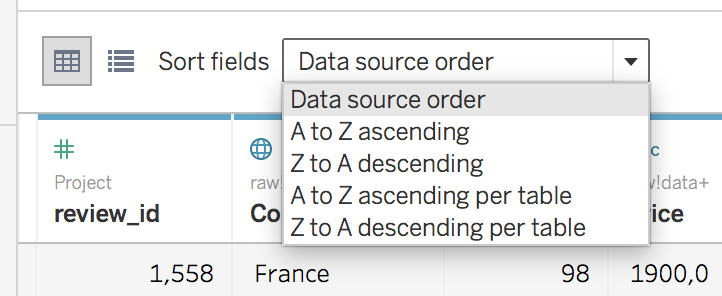
In our preview, we are reviewing the first 1000 rows of the resulting table from combining three different Excel sheets (in our case, it would be the three sheets in this Excel file). Tableau also defaults to the data source order. This means that it will sort rows based on the Excel sheet they were in. There are other options to sort the rows of data that you see in the data preview area. Click on the drop-down arrow for Sort fields (in the top-left area) to see the other options.
Hiding Columns
Most data analysis projects require some amount of data cleaning. Sometimes, you have columns in your dataset that you do not need for your project. In Tableau, you can hide them by clicking the drop-down arrow (or right-clicking the column header area) and selecting Hide.
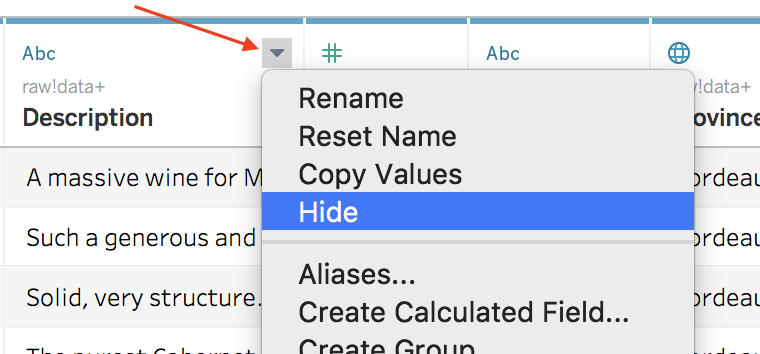
As mentioned earlier, you are not actually deleting the columns, but you are instead filtering them out from the workbook file.
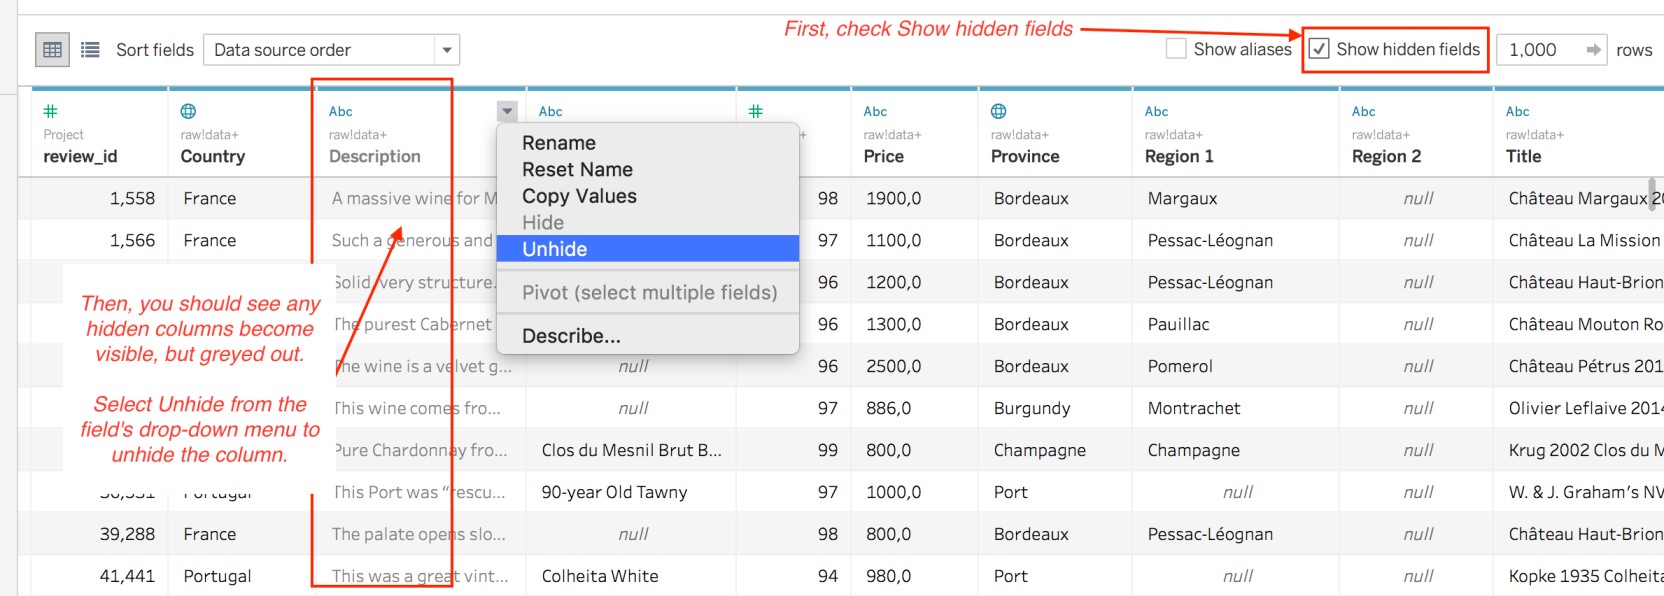
If you need to "unhide" the columns later down the road, then all you need to do is return to the Data Source page, and click on the checkbox for Show hidden fields, as shown below. You should see the hidden columns grayed out, but visible. Then, you can click on the drop-down arrow for the column and select Unhide.
After combining data, Tableau creates columns in the dataset. When you use a union to combine data from different tables, Tableau creates two columns (Sheet and Table Name) to inform you what the original data source is for the row of data. When you use a JOIN, Tableau brings in the common column from all the data tables involved. In our case, we have the T code column from the left table and the T code column from the right (wine_experts) table.
We needed both T code columns to carry out the join (remember the yellow join column from the previous chapter?). Now that we have joined the tables using the T codes, however, we no longer need these fields for our analysis. Let's go ahead and hide them as well as others that are not useful.
Can you identify those columns? Answers below!
Hide the columns listed below:
Sheet
Table Name
T code
T code (wine!experts)
Description
Designation
Region 2
You should have only the columns displayed below in Section E of the Data Source page:
Set Data Types
Tableau is pretty good at inferring the correct data types for your columns. However, sometimes they don't get it right, or you need to correct the data type that was set. For example, let's take a look at the review_id column. You can see that it has been set as a numerical data type by looking at the data type icon in the upper-left area of the header, as shown below.
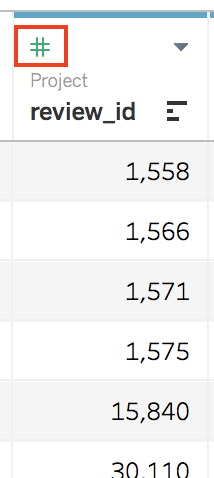
If you take some time to understand the review_id field, you will see that it contains the unique row ID for the rows in the dataset. Even though the IDs are a series of numbers, they should be treated as identifiers for the rows of data and not as data values that can be aggregated. So, the review_id field should be set as a string field instead of a numerical data type. Let's fix that!
First, click on the data type icon for the review_id field, and you should see a menu of options.
The numerical (decimal) data type is for fields that contain numerical values with decimal points. It is also known as the float data type.
The numerical (whole) data type is for fields that contain whole number values. It is also known as the integer data type.
The date and time data type is for fields that contain timestamps.
The date data type is for fields that contain dates.
The string data type is for fields that contain text (string characters).
The Boolean data type is for fields that contain one of two possible values such as 0, 1, True or False.
The geographic role data type is for geographical data.
Then, select the String option, and it is as easy as that! Notice how the values in the review_id column no longer have the commas displayed. This is because Tableau sees strings instead of numbers, which is correct for this column of codes (i.e., row IDs).
Now, look at the Country column. The data type icon displays a globe, which represents the Geographic data type. One of the powerful features of Tableau is the ability to visualize data onto a map using different types of geographic data.
Besides longitude and latitude coordinates, Tableau can infer the following geographic data values:
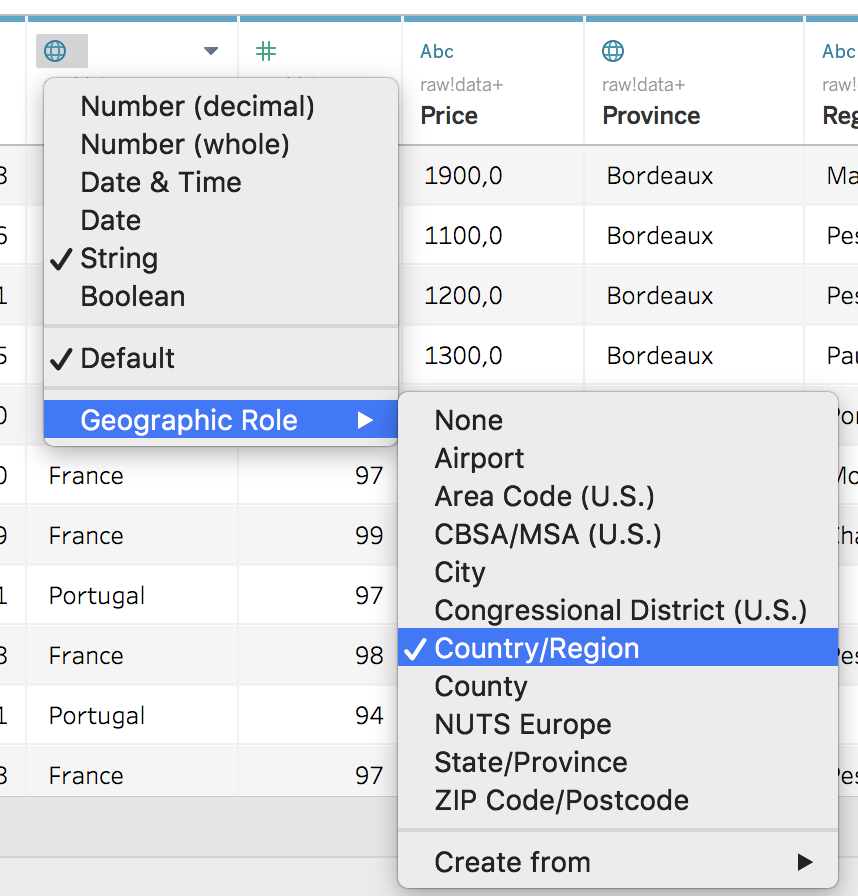
As long as your dataset has a column containing any of those geographic data types, you will be able to create map visualizations with your data. In a later chapter, we will discuss the Create from option.
Replace String Values, Such as Commas
It looks like the rest of the columns have the correct data type, except the Price column. The data type for that column is set to a string instead of a numeric type. You can also see that there are commas in the data values. :euh: Well, looks like we have some data cleaning to do!
This means that we will have to address those commas, or Tableau will not be able to infer the numeric value correctly. In fact, if you try to set the data type for the Price field as Number (decimal) before addressing the commas, Tableau will convert the data values incorrectly.
What we need to do is:
Create a new column (also known as a calculated field) from Price, and remove the commas using a Tableau function called REPLACE().
Change the data type of the new column to Number (decimal).
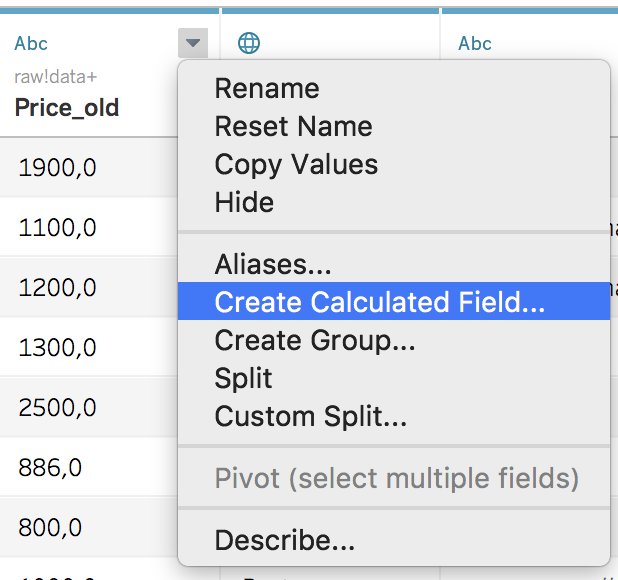
Let's go ahead and rename the Price column to Price_old (we will eventually hide it). To rename a column, you can either double-click on the field name or select the Rename option from the drop-down menu for the field.
Now to create the new column, click open the drop-down menu for the Price_old column, and select the Create Calculated Field... option, as shown below.
A window will pop up on your screen. There, you will use the first area to change the name of the new column from Calculation1 to Price, as shown below. In the second area, type out the Tableau code or logic that is needed to create the new column. We will be using the Tableau function called REPLACE with the Price_old field to create the new column. Tableau has already added the notation for the Price_old column (which we are basing our new column on) in the second area.
Put your cursor at the start of the line of code, and type out the following:
REPLACE([Price_old], ",", ".")
As you are typing, you can see that Tableau will provide some helpful information to guide you.
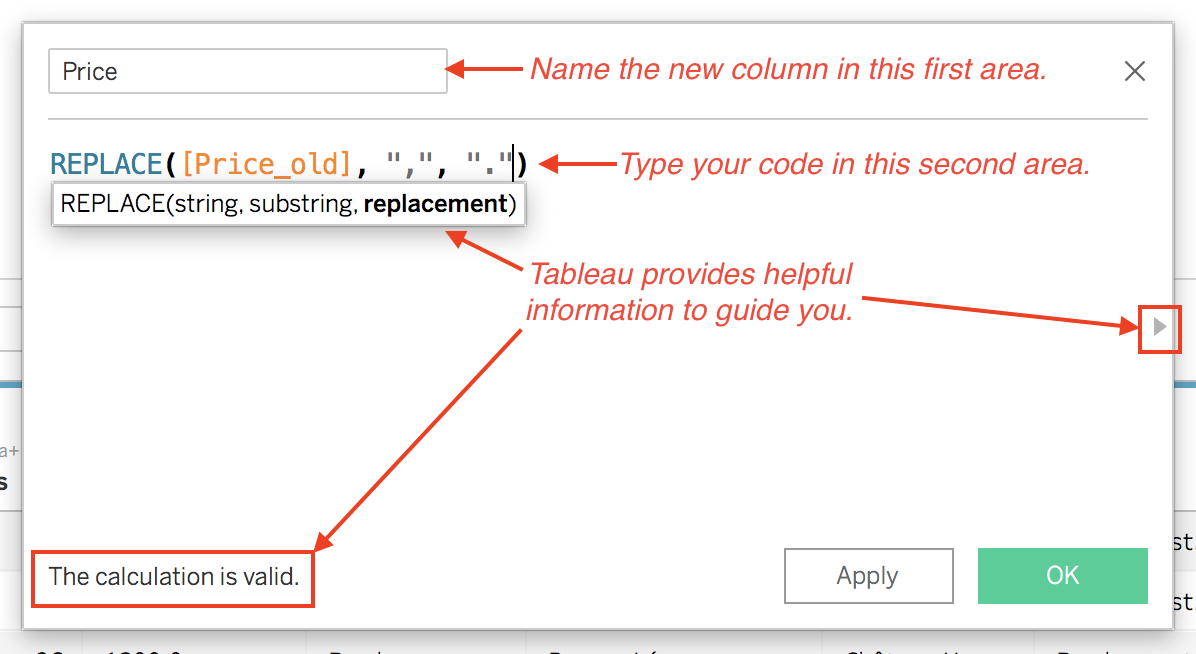
This REPLACE() function is telling Tableau to go to the data value in the[Price_old] column, find a comma substring character "," and replace it with a decimal point "." (or rather, a period).
Make sure there are no errors in your code and that the calculation is valid (lower-left corner of the window). Then, click OK or Apply.
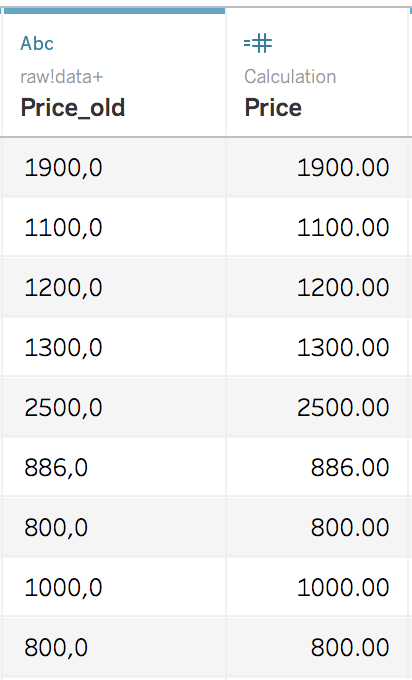
Now you should be able to set the Price column as a Number (decimal) data type, and Tableau will be able to convert the data values correctly. Take a look below at the difference between the Price_old column and the new Price column.
Go ahead and hide the Price_old column since we do not need it anymore. At this point, I highly recommend that you save your work!
Remember Section F?
Let's end this chapter with a discussion about Section F of the Data Source page (lower-left area), shown below.
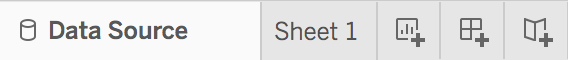
The Data Source tab will take you to the Data Source page.
Any sheets that you have created in your Tableau workbook will appear after the Data Source button. You should see a tab for Sheet 1, which will take you to that sheet.
Then, you have three different ADD icons: New Worksheet, New Dashboard, and New Story.
When you select the New Worksheet icon (the first ADD icon), Tableau will create a new blank worksheet. We will use the New Dashboard and New Story icons in Part 3 of this course. For now, we will only be using the New Worksheet icon.
Summary
Most data analysis projects require some amount of data cleaning.
Tableau does not change the original data files that are used to load data into the Tableau workbook.
Tableau does, however, allow you to:
Hide (or filter out) columns.
Set data types.
Replace data types by creating calculated fields.
We can prep the data now that it's been cleaned, which is the focus of the next chapter!
