Stories, New Data Sources, and More!
What? MORE STUFF? o_O
Make Use of Tableau's Story Feature
Just as the dashboard sheet allows you to put several visuals into one page, a story enables you to put several dashboards (and worksheets) into one page with the use of tabs, as shown below.
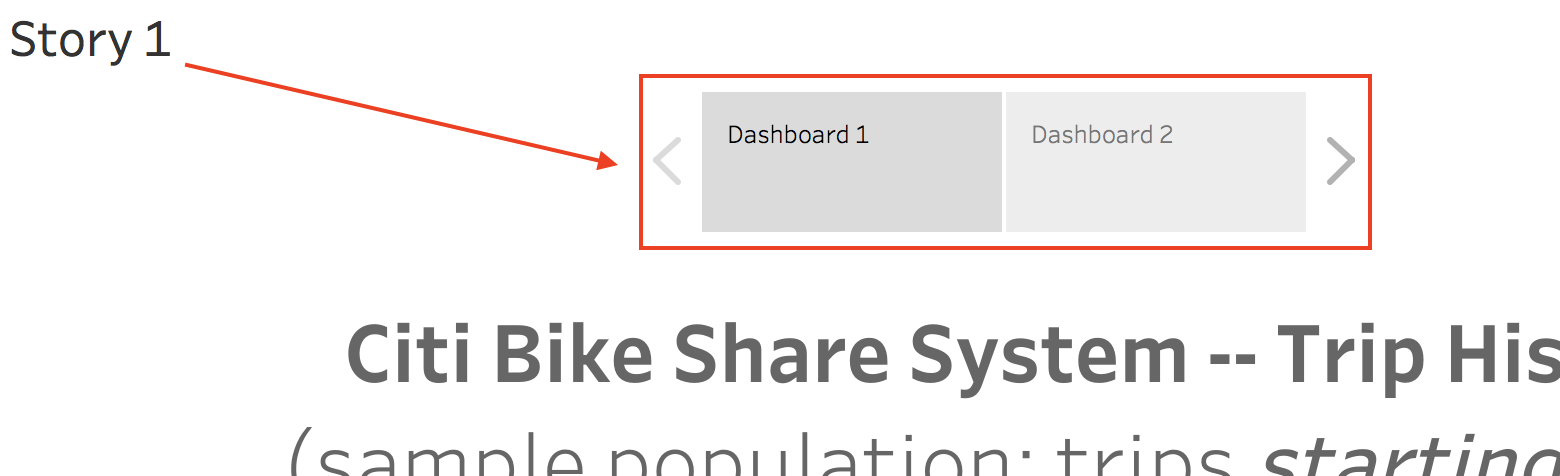
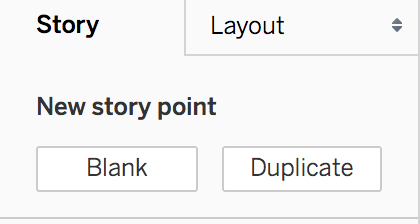
To add tabs to your story sheet, choose between a Blank tab or a Duplicate of one in the top left-area of the sheet, as shown below. Then you can drag and drop available dashboards and worksheets, and arrange as needed into the different story tabs.
Refresh or Replace Data Source
Many times, you may need to refresh the data source that is feeding into your dashboard. For example, if you have a dataset that is updated with new data every quarter, then include it in the dashboard using the dataset. Anytime that the underlying data file is updated, you will need to refresh the dashboard's data source.
There are different ways to refresh your data source, depending on which version of Tableau you are using. In this section, we will focus on the data source refresh method for Tableau Public Desktop.
Refresh the Data Source in a Tableau Public Dashboard
Navigate to any worksheet that you have created.
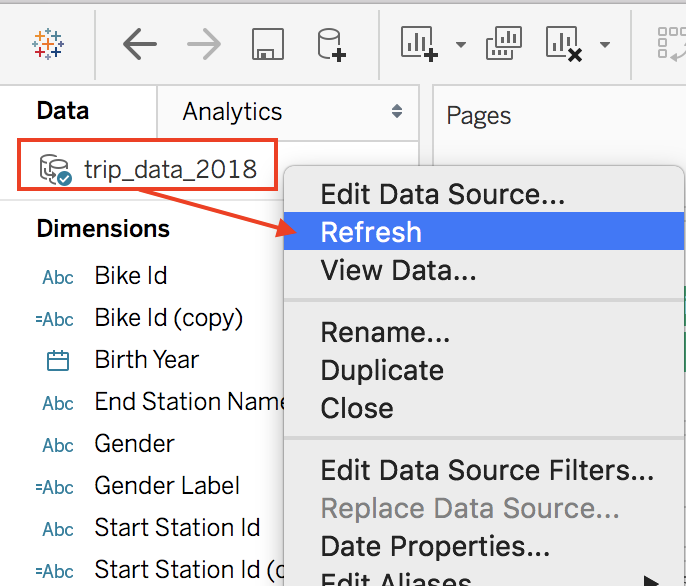
Locate the data source listed above the Data pane (as shown below).
Right-click the data source, and select the Refresh option.
Review the data preview section in the Data Source page to confirm that the data source has been updated.
Sometimes, you may need to replace the data source altogether. As long as the new data file that will be used to replace the existing data connection has the same fields, you will be able to replace the data source of a dashboard.
Replace the Data Source in a Tableau Public Dashboard
Go to the Data Source Page, and click on the Add connection link, as shown below.
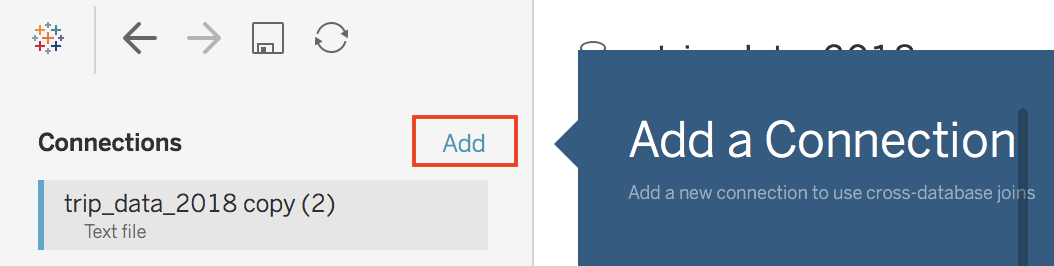
Navigate to the data file that will replace the current one, and click Open.
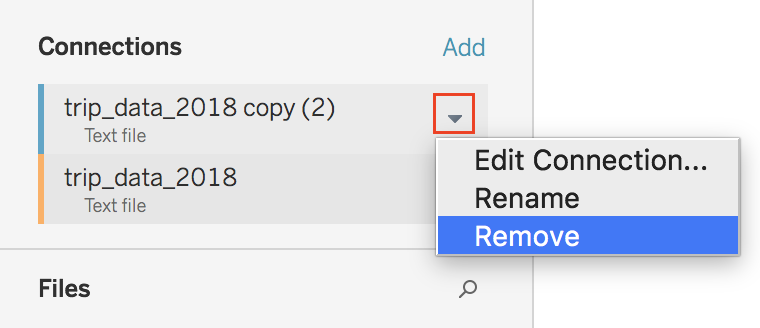
Once you have the new data source connected, click on the drop-down arrow for the older connection (it will be color-coded blue, and the new connection will be color-coded orange).
Then select the Remove option, as shown below.
Once the old data source has been removed, you will need to drag the data table from the Files/Sheets section into the visual workspace.
You may also have to reset the data types for the new connection (Tableau will default to what it infers).
Export and Share Workbooks
After all the hard work that you have put into a dashboard project, you will be ready to share it with your team, clients, and stakeholders. There are several options that you have for sharing your work in Tableau Public Desktop. You can share a link to your published workbook that is hosted on the Cloud, or embed your visuals using the embed code that Tableau provides. You can also export your workbooks as any of the file formats listed below, and share the downloaded file.
Image
Data
Crosstab
PDF
PowerPoint
Tableau workbook
Regardless of which option you choose, you need to first save, or publish, your workbook file to access those aforementioned options.
Once you publish your workbook, a tab will open up in your internet browser window. In this tab, you should see the dashboard displayed in its full glory. If you scroll down to the very bottom of your published sheet, you should see the icons shown below.
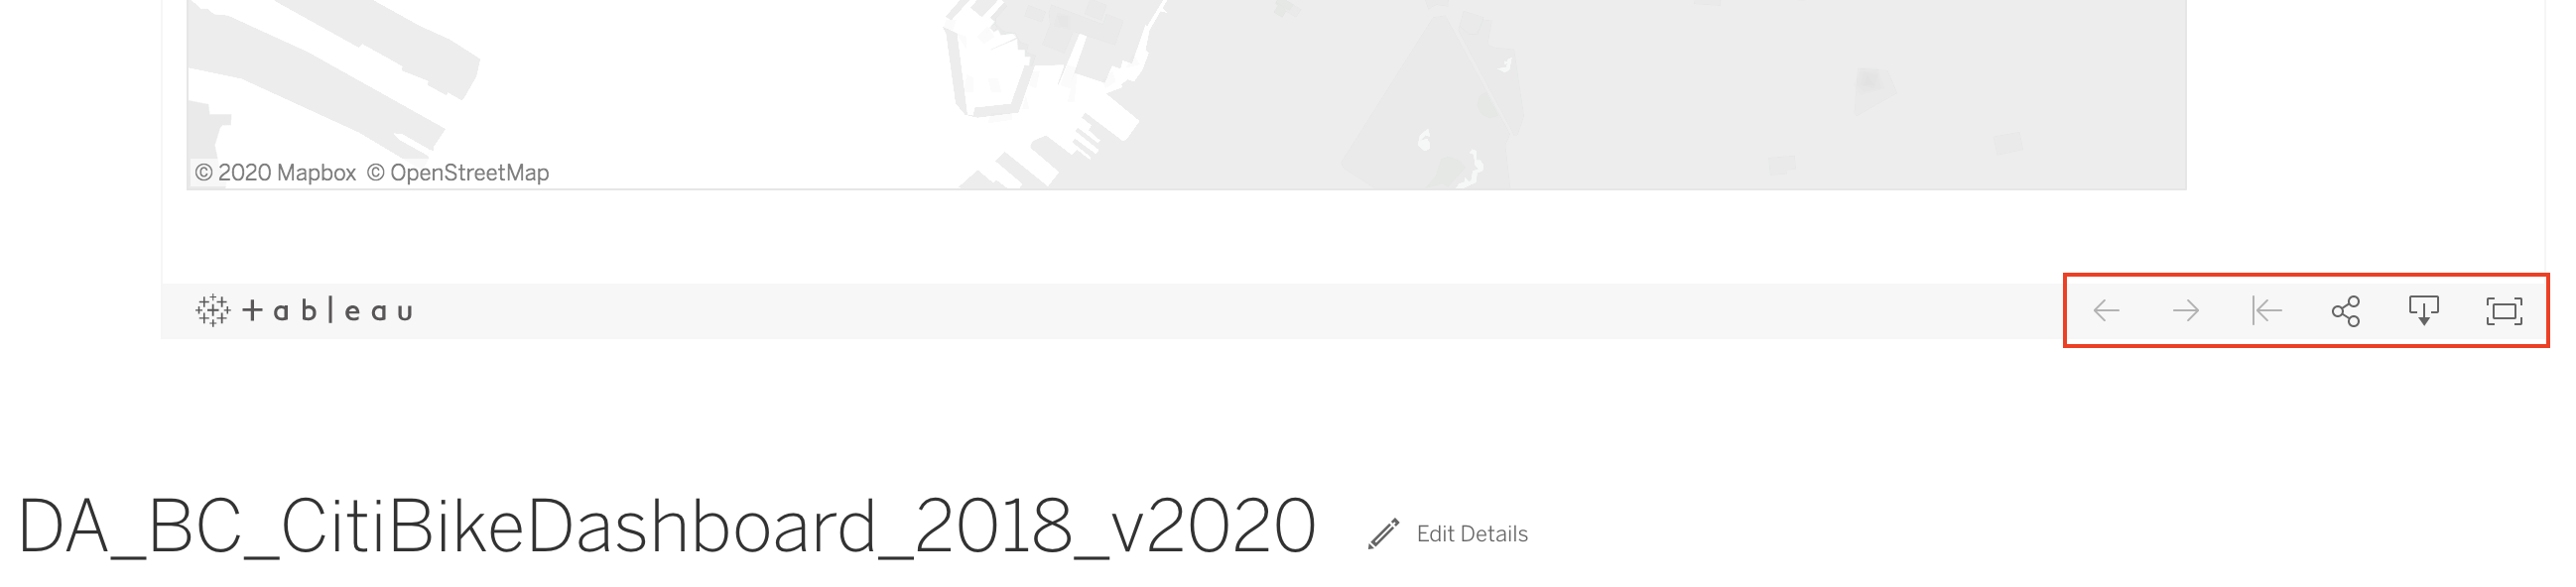
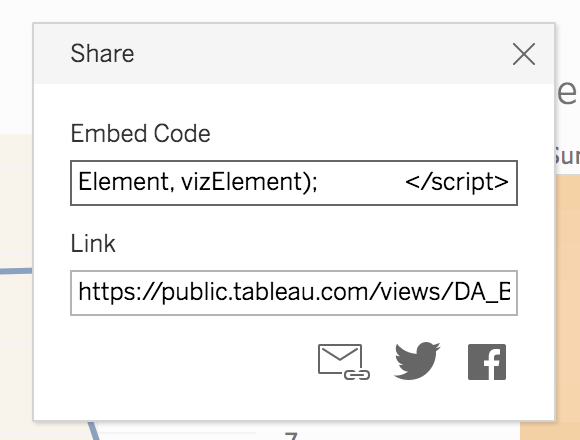
Use the Share Link Icon
When you click on the share link icon, Tableau provides a URL link that you can share with stakeholders. This link takes visitors to the same view in the browser tab that opened up when you saved the workbook. Tableau also provides the embed code for embedding your visuals into websites or other places where you can embed code.
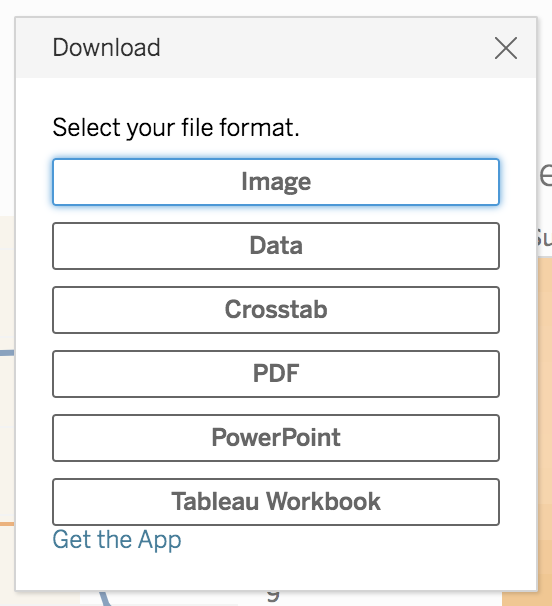
Use the Download Icon

When you click on the download icon, the Download dialogue window opens with the file format options that are available to you. Once you select which file format to export your visuals, the file is downloaded to your computer. Then you can share or use the downloaded file as needed.
Next Steps To Continue Your Learning Journey
So here we finally are: the official end of this course! :magicien: :ninja: :soleil: :zorro: :D
You are now ready to unleash your newfound skills and create impactful dashboard deliverables with the data viz software, Tableau. Although you have mastered the basics, there's always more to learn to enhance your skillset! As you continue your learning journey, be sure to check out the resources below as they contain topics essential to any data analyst.
Create Groups
Create Sets
LOD Expressions
