Discover the Concept of Team Velocity
Understanding Velocity in Project Management
Velocity is a measure of the amount of completed work a team can deliver in a sprint.
It is a calculation that is done after a sprint is completed. Look at what user stories were fully completed and add up the total estimated story points. This enables you to see the total amount of story points for that completed work.
Knowing what the team actually completed in the last sprint (or the average over the last few sprints) is an excellent insight into what the team can potentially deliver in the future.
Velocity looks back at what a given team has actually done - and uses this as a basis for planning and estimating.
How to Calculate Velocity
Velocity is calculated in the following way:
Take a set of (small) user stories that you think you can deliver in a sprint.
Estimate each user story using story points.
See which user stories are completed after the sprint is finished.
Add up the estimated story points of those completed user stories.
This total is the team's velocity for that sprint.
Do this for at least three sprints and calculate the average velocity - this is your team's overall velocity.
Partially Completed User Stories
To calculate velocity, count the estimates for user stories that are completely done. If a user story was not started or finished, then do not count their estimated story points as part of your velocity for that sprint
It may be obvious that if you don't start a user story, then you don't count its estimated story points in your total of velocity for that sprint. But what if an item is 99% done?
The answer is simple. If it's not completely done and ready for release, then don't count its story points.
Definition of Done
Although it is very clear that only user stories that are completely done can be counted in your calculation of velocity, there may still be disagreements within the tech team about what done means. For that reason, it is standard practice in Agile teams to have a definition of done.
Think of a definition of done as being a pre-release checklist. If you have completed each of the items on the list, then the user story can be released on your site to real customers.
Here is a sample definition of done for a given user story:
All of the automated tests for the user story run without failing.
The QA (Quality Assurance ) team has tested this feature and not found any defects.
The QA team has verified that all acceptance tests have passed.
The code was peer-reviewed.
The product manager has tested the user story and verified that he/she is happy.
Any measures of code quality are above an acceptable threshold.
No security issues have been found.
All documentation has been updated.
Why Use Velocity?
Velocity allows you to forecast how many stories you can do in a sprint. It is an empirical measure that looks at past performance to estimate future performance.
In practice you need to have completed at least three sprints as a team before you can estimate velocity.
Here are some benefits of knowing the team's velocity:
The Product Owner can do release planning using velocity and story points . Given a set of estimated user stories and the team's velocity, the Product Owner can calculate how many sprints are needed. If you have a set of user stories with total estimates = 77 story points and the team velocity is 20 points per sprint, then you need four sprints.
The team can quickly identify which user stories must be carefully deconstructed during sprint planning. If the team has velocity of 20 points and the Product Owner has prioritized user stories of 13 points, five points and eight points, then the total is 26 points and won't be possible in one sprint. The team should take the first two user stories (of 13 points and five points) and use the sprint planning meeting to develop a plan to deliver those two user stories during the next sprint. The team could look to do some of that third eight-point user story but it won't be completed.
You can monitor the team's performance over time.
Discover Velocity Charts
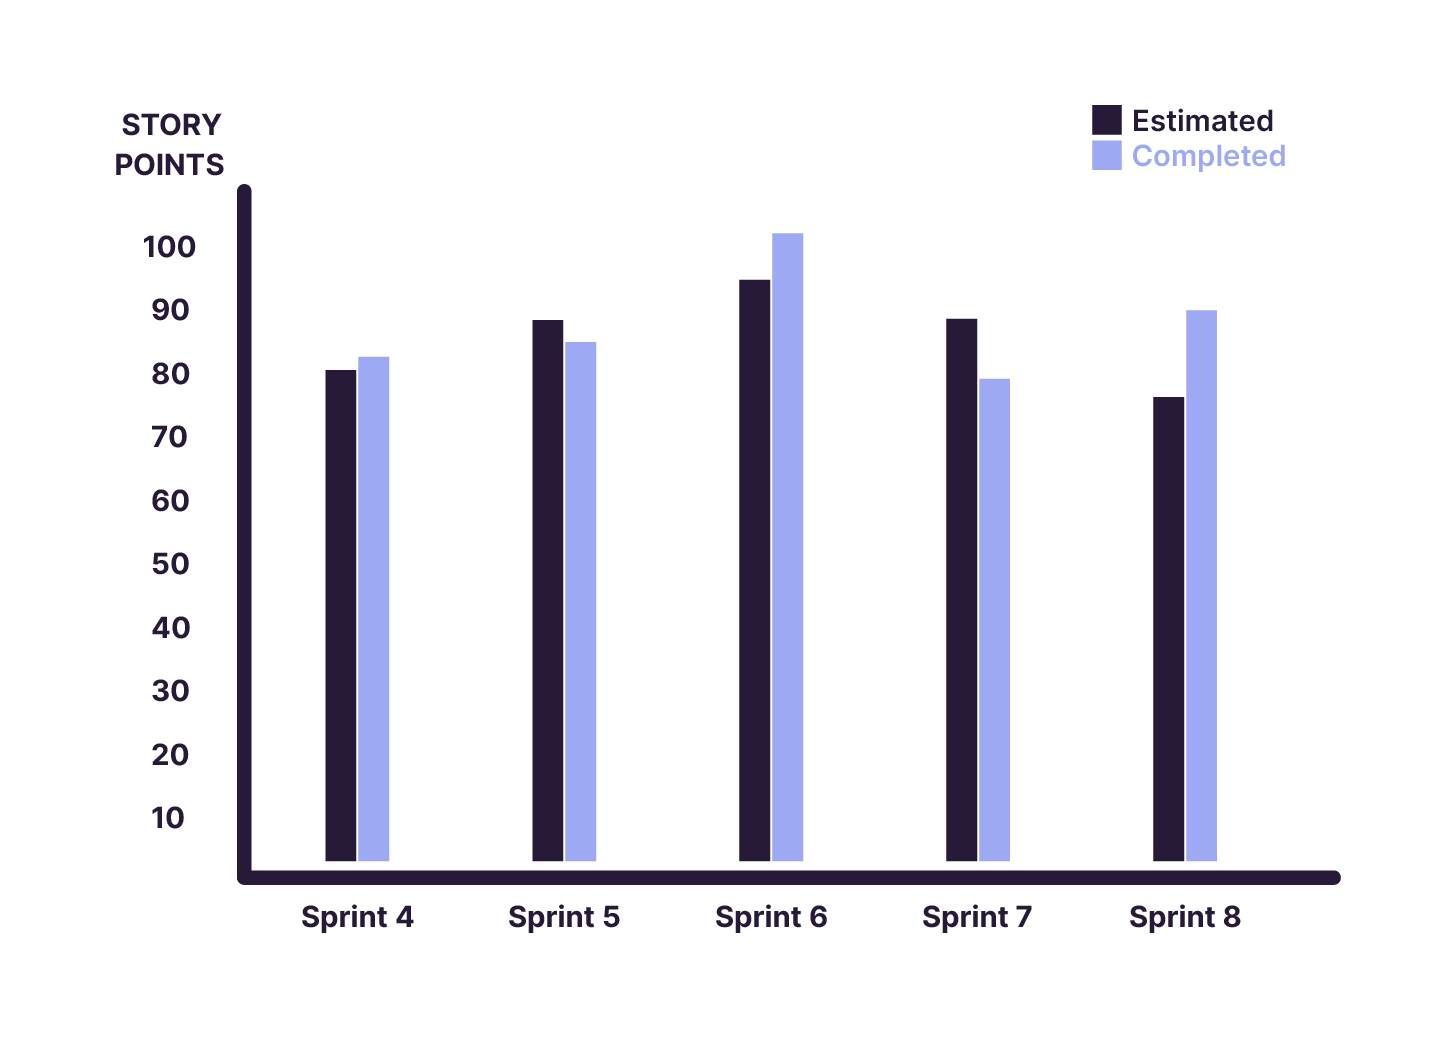
Tracking velocity over time is a useful exercise that can help to understand the performance of the team. A velocity chart is a chart that shows two columns for each sprint:
The total estimated story points (what the team thought they would deliver)
The total completed story points (user stories that were completed and met the definition of done)
Remember not to count an almost completed user story when calculating velocity.
Look at the following example.
The average velocity of your team is 20 points.
In a given sprint, you almost complete a 13 point user story but you don't quite finish. In fact, you only manage to complete one user story worth five points. Your velocity for sprint 15 is five points.
In the following sprint, you quickly complete this user story and manage to do other user stories worth 20 points. Your velocity for sprint 16 is 31 points.
You can see that not counting user stories unless they are fully done can lead to a seemingly big variation in velocity. This is referred to as see-sawing and means a better breakdown of user stories may be appropriate.
Always take the average of at least three sprints to mitigate the effects of an almost done user story causing a see-saw effect in your calculations.
Let's Recap!
Velocity is a measure of the amount of completed work a team can deliver in a sprint and is done after a sprint is completed.
Calculate velocity by looking back at previous sprints. Add up the story points of fully completed user stories in recent sprints and calculate an average.
Tracking velocity can help to understand the performance of a team, and allows you to forecast how many stories a team can do in a sprint.
Additional Resources
PremierAgile article on velocity and how to measure it.
Agile Alliance article on the benefits and pitfalls of velocity.
An AgileConnection article The Veracity about Velocity.
You now have everything you need to create your Release Plan. Let's dive into it in the next chapter!
