Annotate your User Story Map to Highlight Valuable Information
Adding Information to a User Story Map
In this chapter, we will learn how to add even more information to a story map so that it radiates (i.e. gives out) even more information to the team and relevant stakeholders.
A story map is an artifact that the tech team and stakeholders should refer to many times during the course of building a product.
Annotating Your Story Map
Annotate your story map with the following things:
User photos
Blocked user stories
Assumptions and risks
UX or wireframes
1. Adding User Photos
In some products or systems, there are multiple actors or user types.
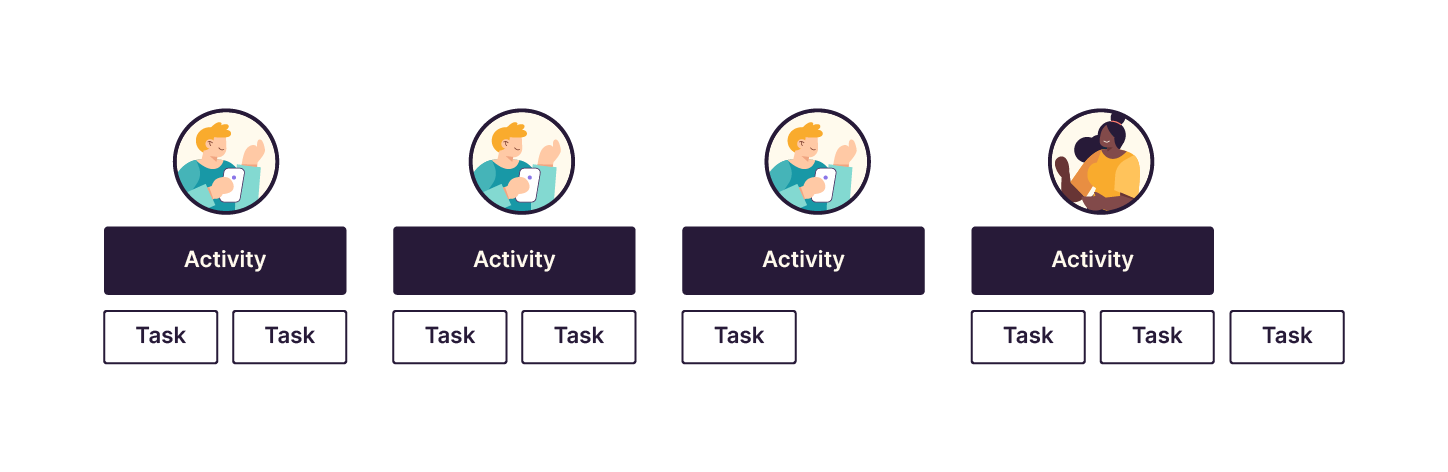
For example, a medical system could have user types for patients, doctors, nurses, and administrators. When there are multiple users, it can be helpful to use a photo on the story map to visually indicate which user role is performing each activity.
The photos on the story map below represent each user type. The photo is above the related activity. You could also add the name of the user type (e.g. patient or doctor etc.) underneath the photo if that would help identify the represented user.
2. Indicate Blocked User Stories
The tech team will sometimes be unable to start or complete a user story when they are dependent upon external factors for assets or information.
Dependencies are not uncommon. The tech team often relies on others outside the team to provide translations, graphic designs, technical components, or even just an answer to a question.
A story can be marked as blocked when dependencies prevent the team from advancing. This means that there is an impediment preventing the team from completing the work.
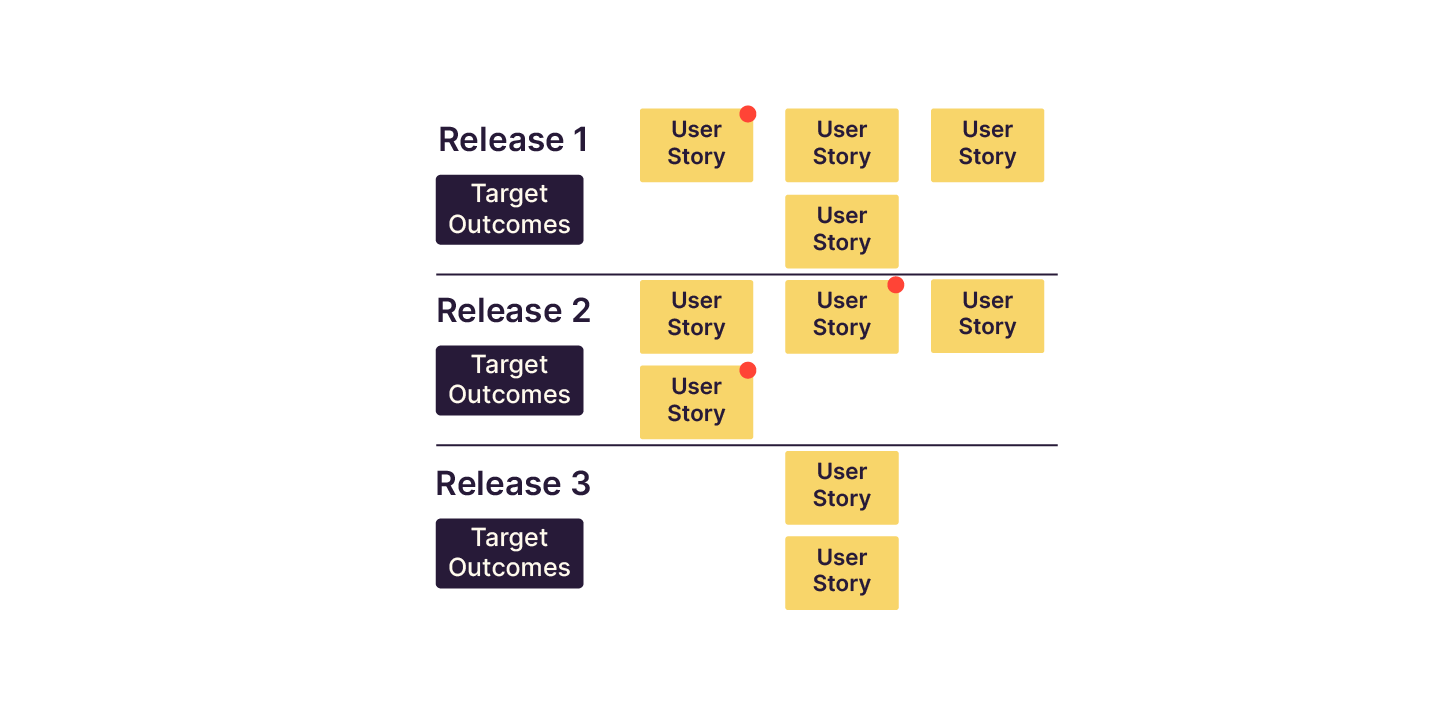
Red dots or sticky notes are an effective way of indicating when progress is blocked.
There is a great benefit to seeing blocked items at a glance. It's easier to count how many blocked users stories there are when you can see them on the story map.
The dots or sticky notes also help visualize how many blocks there are per release. That way you can prioritize them according to urgency. If there is a block on a story that is two or three releases away, it is not as important to investigate as one that is coming up. Everyone on the team can easily see the blocked items as well.
3. Identify Risks and Assumptions
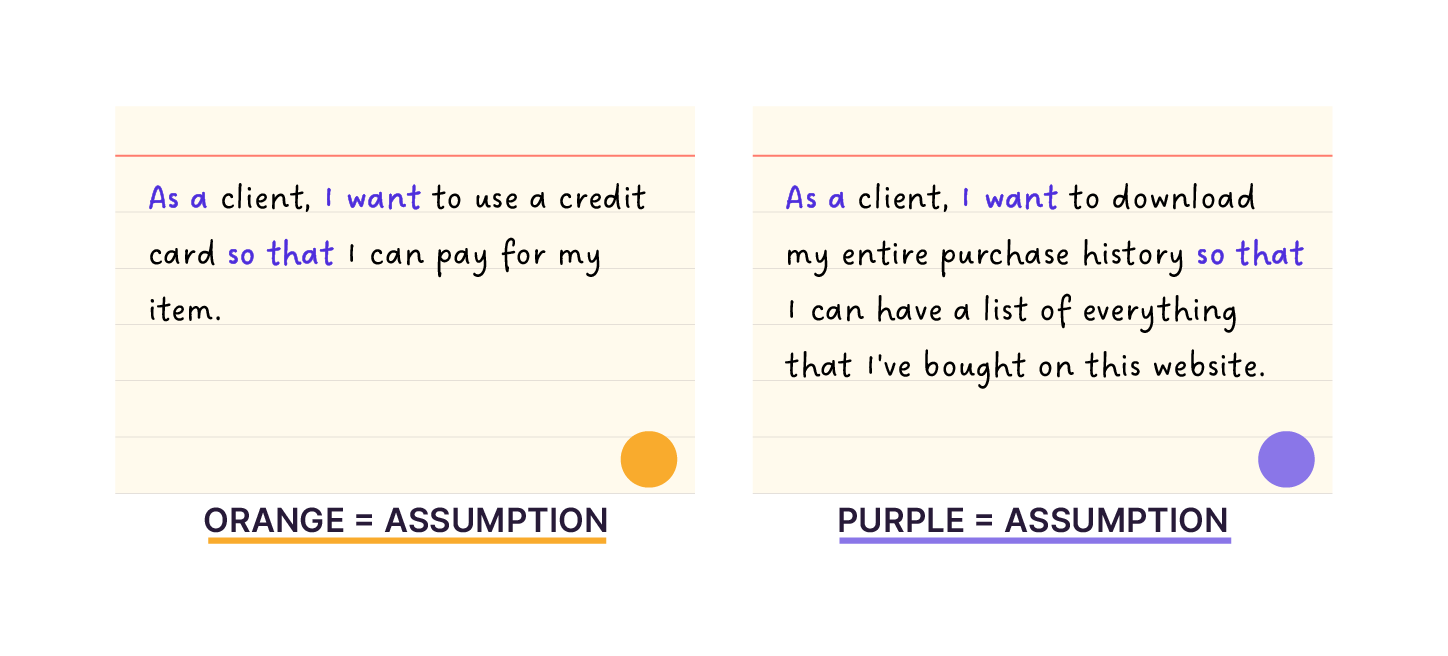
It's also important to show which user stories contain either assumptions or risks. Just as blocked user stories can be denoted with a red dot, other color-coded dots can be used to highlight stories that contain risks and assumptions.
An example of a risk could include a user story that may result in code that will not perform well with high volumes of user traffic. An example of an assumption might be that users can only make purchases with credit cards and not other online payment platforms like Paypal for example.
Assumptions and risks are often identified during planning sessions. You could even write the risk or assumption on the back of the card or post-it note as a reminder.
4. Add UX or wireframes
If your graphic design team has created some wireframes or graphical elements, (often referred to as the UX or "user experience" of a product) you may want to add them to the story map also.
This can help others outside the team better understand what the releases will feel like when users perform the relevant set of activities and tasks.
Consider adding the wireframes to the right of the story map as shown in the diagram below.
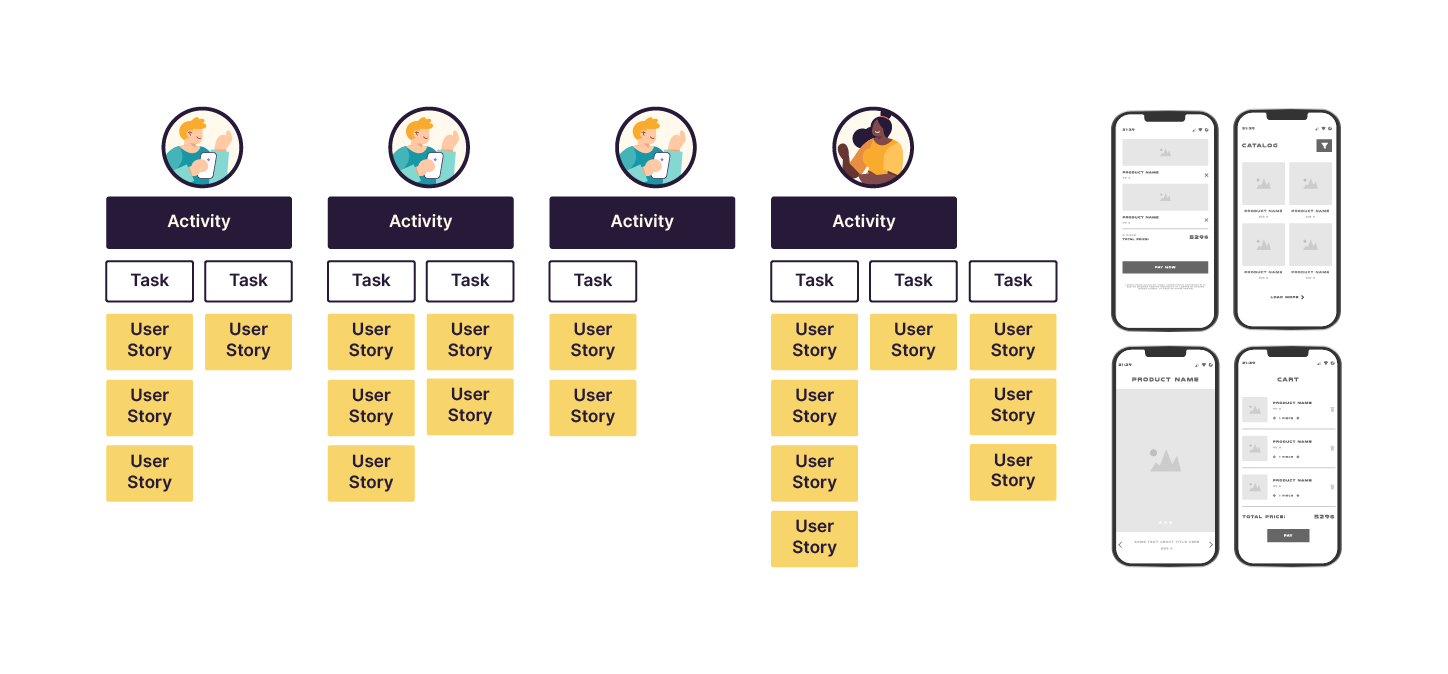
In the story map above, you can see not only how your user stories map to the activities and tasks of various user types, but also which releases contain which user stories and also what the interface looks like!
This is much more information than a list of user stories in a spreadsheet!
Should Story Maps Change Over Time?
The story map is not just a tool for launching a new product. It can also be used in the life cycle of an existing product. You can develop it over time and create the next swim lane and sprints.
The main advantage of a story map is not the map itself, but the approach to structuring the backlog. You may build a flat backlog and it will contain all the necessary information about releases, sprints, timelines, and pieces of functionality. However, the story map provides you with a visual tool, and gives you a place to note any explanations you may need.
Let's Recap!
The story map radiates information - almost like a radiator. This means that team members and stakeholders can see valuable information just by looking at the story map.
Adding the following information to your story map makes it even more valuable:
User photos to indicate which user types perform each activity
Blocked user stories
Any user stories that contain assumptions or risks
Graphic designs or wireframes
Additional Resources
I recommend Jeff Patton's book on user story mapping.
Creating user story maps isn't just a solo activity. Find out how you can make one as a team in the next chapter!
