Learn the most common metrics for mobile apps
A mobile app is a software application designed for use on mobile devices. Four major metrics are examined to understand the performance of a mobile app:
Installation metrics
Engagement metrics
Revenue metrics
App Performance metrics

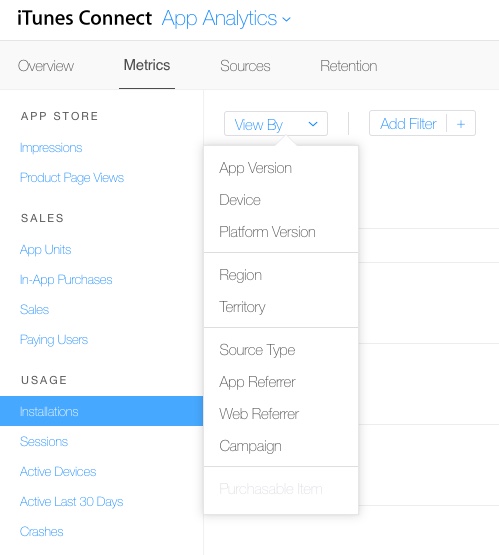
As you are probably aware, in order to use an app on a phone, people must install that app on their device. As the creator of an app, you can access the installation metrics through the iTunes Connect or Google Play stores.
Important metrics to track are:
Installs - how often your app is installed.
Uninstalls - how often the app is uninstalled.
You may further want to analyze your installs and uninstalls by breaking them down into various dimensions:
By region - which geographical region had the most installs/uninstalls.
By device type - which devices (e.g. iPhone 7, iPhone 8, Samsung S9, Galaxy Note) has the most installs /uninstalls.
By marketing campaign - which of your marketing campaigns had the highest installs.

It's great if users install your app. But what really matters is that they start to use the product in a way that generates value for them. You can use the following metrics to see how much users love your app:
DAU - Daily active users.
MAU - Monthly active users.
Daily sessions - How many times the app is opened in a day.
Average sessions per user - This is Daily Sessions divided by Daily Active Users (you could have weekly or monthly equivalents also). If you have 100 users in a given day, and there are 300 sessions, then an average user has three sessions per day. Highly engaging apps such as Facebook, WhatsApp, or Instagram may have very high average sessions/day because users typically use these products many times per day.
Average time spent per session - The longer users spend in your app, the better for you (assuming it is not because of poor user experience or slow performance).
App ratings - When a user leaves a rating (typically a rating out of 5 stars), this can give you effective insight into how they feel about the app.
App reviews - As well as choosing a score out of 5, users can leave comments to explain why they do or do not like your app. Particularly in the early days, when you are releasing the first versions of your app, you need to check that ratings and reviews are acceptable.

Revenue metrics help you understand your profitability.
Common things to measure in an app are average revenue per user (ARPU) and average revenue per paying user (ARPPU).
ARPU = Revenue/total number of users.
ARPPU = Revenue/total number of paying users.
Although these metrics are relatively straightforward to calculate, let's look at how you can interpret them. ARPU can be interpreted as your ability to monetize (make money from) your users by providing an experience and offering that encourages them to pay.
Note that ARPU (and ARPPU) are both measured over a given time period. You can measure the revenue and number of users over a daily/weekly/monthly/quarterly/annual time frame. The most common is a monthly measurement. In this case, monthly ARPU = the revenue from that month / total number of users.
When the ARPU rises, it means you are doing more things (adding more features as one example) that your users appreciate. It means you are doing a good job of delivering value to your users.
When monetizing an app, it is possible to either:
Sell the app (meaning you must pay before you can install the app) or
allow a basic version of the app for free but to require the user to purchase additional options within the app.
This latter option is called an in-app purchase or IAP. Example of IAPs are:
Using a free version of a service like Dropbox, Evernote, Slack or Tinder and then paying within the app for additional limits or functionality.
Using a free version of a service like Skype and then buying a number of credits (which in the case of Skype would represent an amount of phone credit that can be used).
Using a free version of a game and then buying a super-turbo weapon that wipes out all your enemies.
If your app does sell in-app purchases, it is important to track which of these IAPs are selling and how revenue you generate from each.

It is important that an app provides an excellent experience for users. Any app that is slow or doesn't work well will be uninstalled straight away by users. App performance metrics allow you to discover performance issues before many users suffer a bad experience.
Things that you can track include:
Latency - Latency refers to the time delay between a page request and a page load. You can measure this and it will tell you how fast your app is.
Network errors - This measures how often your app fails to load a page because your users do not have sufficient Internet connection.
App crashes - An app will sometimes crash, often when you attempt to first open it. A crash is an app experience that is non-responsive. An app crash has happened to most of us. Sometimes we kill the app and try it again, but sometimes users will just decide they can't be bothered any more. The rate of app crashes should be under 1%.
Summary
Mobile apps are software applications installed on the user's mobile device.
Important types of app metric include:
Installation metrics
Engagement metrics
Revenue metrics
App performance metrics
Additional resources
Some important mobile metrics.
