Analyze web conversion with Google Analytics
In previous chapters, we've looked at how:
The acquisition section of Google Analytics can be used to tell you about the source of new visitors to your site and where these visitors came from.
The Behavior section of Google Analytics can be used to examine which pages were visited and what visitors actually did on your site.
Now we will look at the Conversions section of Google Analytics. When you input into Google Analytics which visitor behavior you really value (i.e., what are your goals for visitors), then Google Analytics will tell you which percentage of visitors convert into performing these goals. Conversion reports help you understand when users perform actions that you have predefined as goals.
Goal types in Google Analytics
There are four different types of goal that you can set in Google Analytics:
Destination goals
Duration goals
Pages/screens-per-visit goals
Event goals
Let's examine each of these in more detail:
Destination goals should be set when you want to measure that a visitor actually visits a specific page. For example, if a customer sees a "thank you" page after making a purchase, then you can measure how many times visitors see this page. From that data, you can measure how many times a purchase is made!
Duration goals should be set when you want to measure how long a visitor spends on your site. The length of a visitor's session may be of interest if your site requires some careful reading on behalf of the visitor. For example, a university may regard it as a success if a visitor spends 15 minutes reading about the courses they offer.
Pages-per-visit goals should be set when you want to measure when visitors reach a minimum threshold for browsing pages on your site. For example, an eCommerce site might regard a visitor as doing deep research into a purchase only if they look at 20 or more pages on the site.
Event goals should be set when you want to measure events on your site that are not just page views or session duration. For example, you might value when visitors watch a video, download a PDF, or join a mailing list.
Now that you understand what types of goals you can set in Google Analytics, let's look at four reports that help to measure site performance for these goals:
Goal Overview report
Funnel Overview report
Checkout Behavior report
Product Performance report
1. Goal Overview report
Let's look at an existing goal in the Google Merchandising site's Google Analytics dashboard. In this case, we'll select "Purchase Completed" from the dropdown menu:
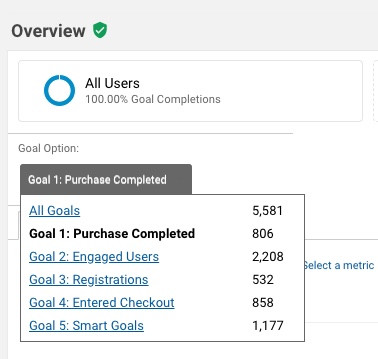
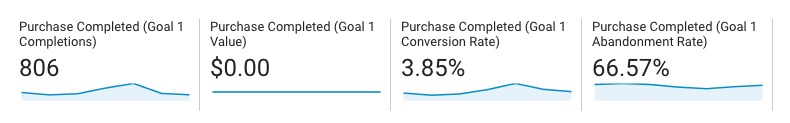
Using the numbers, you will be able to see the level of goal completion (in this case, purchase completion) which tells you whether your specified goal was met. You will also be able to see if there is a monetary value to the completion of this goal (in currency).
2. Funnel report
A funnel is the set of steps a visitor needs to go through before they can reach the conversion. For example, perhaps a user has got to take the following steps before buying a product:
Add product to shopping cart.
View billing and shipping page and make selections.
View payment page.
View purchase confirmation page.
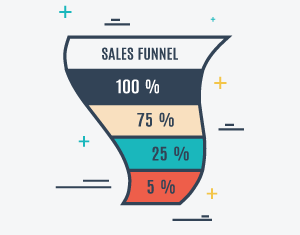
Now let's imagine the the following number of visitors complete each step (for a given day):
Shopping cart = 100
Billing page = 75
Payment page = 25
Confirmation page = 5
Then this funnel might look something like the image below:
To view a conversion funnel in Google Analytics, choose the following menu option:
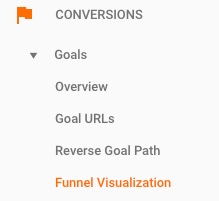
The Funnel report then displays each of the predefined steps of that conversion goal and the absolute number of users and percentage of users at each step.
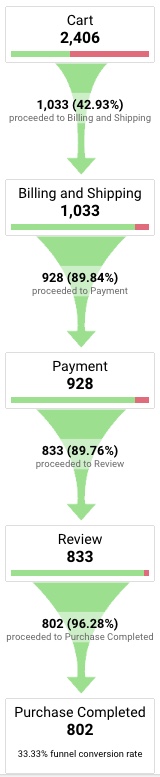
Being able to visualize this data means that you can easily see at which step users are dropping off. If you see that users are making it to step three but very few make it to step four, then it tells you where to look in your product to see what may be the cause.
3. Checkout Behavior report
The Checkout Behavior report yields data on the percentage of users that convert successfully from the make payment to payment step.
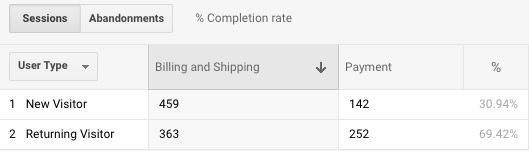
This can also be viewed on the new visitor/returning visitor dimensions.
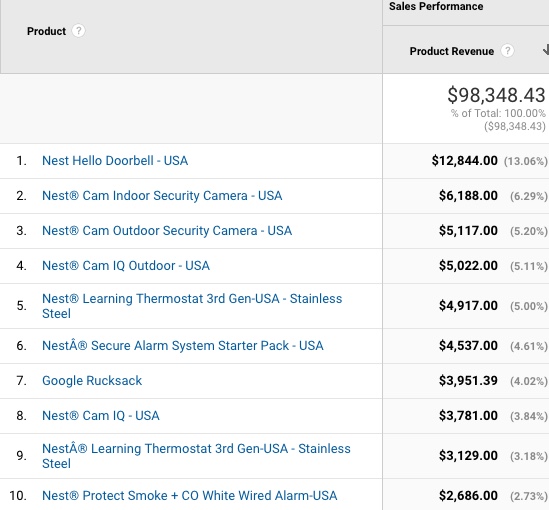
4. Product Performance report
An eCommerce site has one or more products to sell online. The Product Performance result page provides insight into what revenue each individual product generates. It also provides insight into what percentage of total revenue each product contributes.
Summary
Goals are predefined events that help you achieve your business objectives. They represent what you want your visitors to do.
When visitors behave in ways that you care about, such as buying a product, you regard that as a conversion.
Google Analytics helps you understand conversions with some useful reports:
Goal Overview report
Funnel Overview report
Checkout Behavior report
Product Performance report
Additional resources
17 sales funnel examples.
Thank you!
Now that we have reached the end, I would like to thank you for taking this course with me. We have learned a lot about the nature of data-driven decision-making, the types of things that are often measured in eCommerce, mobile, platform, and SaaS domains and taken a deep-dive into Google Analytics.
When you work on your next product, make sure to ask yourself the important question about what is specific to your business and product and what are the key things to measure. Using data to drive decisions will improve the likelihood of your next product being a success!
