Analyze metrics to evaluate product performance
In the last lesson, we saw the actions that comprise data-driven product management by looking at the "Four D's" of data-driven product management:
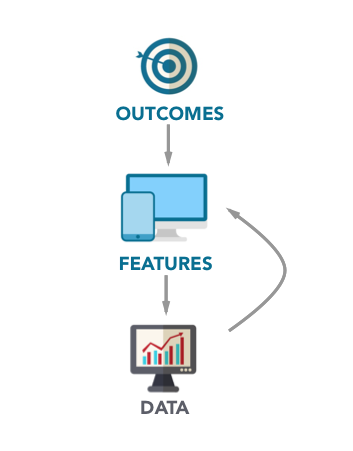
Decompose the organization's strategy into measurable outcomes.
Divide measurable outcomes into specific outcomes for each product team in the organization.
Determine features that each product team can build to achieve their team's target outcomes.
Discern if these outcomes are being achieved by analyzing data and using this insight to improve features.
In this lesson, we will look more closely at how to measure whether a feature was successful. This is done by examining product metrics.
When you release a feature, you need to evaluate user behavior to understand whether this feature is performing as you expected. If you can determine that it hasn't had the desired impact, you can go back and improve it. But first, you must understand exactly where the problem lies.
The Car Breakdown example
Let's say that your car breaks down and you bring it to the garage.
The mechanic will try to find fault by determining which part of the car is to blame:
Alternator
Clutch cables
Spark plugs
Starter motor
Ignition
Other car parts
There are a number of metrics that can be accessed to determine whether a given part is at fault such as:
Brightness of the car's lights
Engine temperature
Dashboard warning lights
The above measurements are metrics. By analyzing them, the mechanic can determine that your ignition is fine, but your spark plugs need to be replaced.

Analyzing metrics for your digital product works in a very similar way.
When your new feature is not working as you hoped, you need to know "which part of the engine" has to be fixed. And then you can do something about it.
Metrics help you know what to fix and where to dig deeper.
Data-driven organizations - setting company-wide goals
In this section, we will look briefly at the way metrics can be used by the organization to drive:
Long-term performance through planning.
Medium-term performance through prioritization.
Short-term performance through measuring progress.
1. Driving long-term performance
As we saw in the last chapter, breaking down company strategy into target outcomes is best done by creating SMART goals (goals that are specific, measurable, attainable, relevant, and time-bound).
Therefore, those responsible for setting company goals may define which measurable outcomes and metrics are most important for the entire company.
If there is an annual goal-setting exercise, then company leaders should define which metrics are the most important and what type of performance should be achieved.

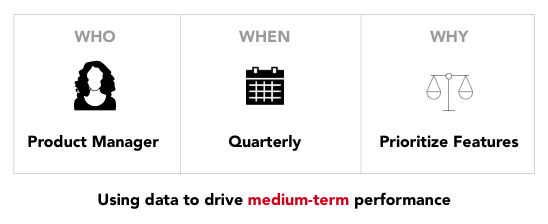
2. Driving medium-term performance
One of the key factors in reaching company goals is deciding which features are the most likely to help achieve the goals (measurable outcomes) that represent company success.
If the goal is to increase revenue, then the product manager will decide which features will be built. To determine which are the best candidates, the product manager may look at the current product to ascertain things like which sell the most, which age group log in most frequently, how have similar features performed. This data is then used as an input in the decision-making process.
3. Driving short-term performance
When features are released, how do you know if they are finished or need tweaking? How do you know if you should move on to the next one?
The answer is to look at the feature's performance. What behavior do you see from actual users in relation to the product and what does it tell you?

The rest of this lesson will focus on how to use metrics to measure progress and in particular how to discern whether a feature has had the desired impact. In particular, we'll look at three tools that you can use to check feature performance:
Feature audits
Cohort analysis
A/B tests
Feature audits
The idea of a feature audit is to take your current product, analyze feature usage, and plot it on a graph.
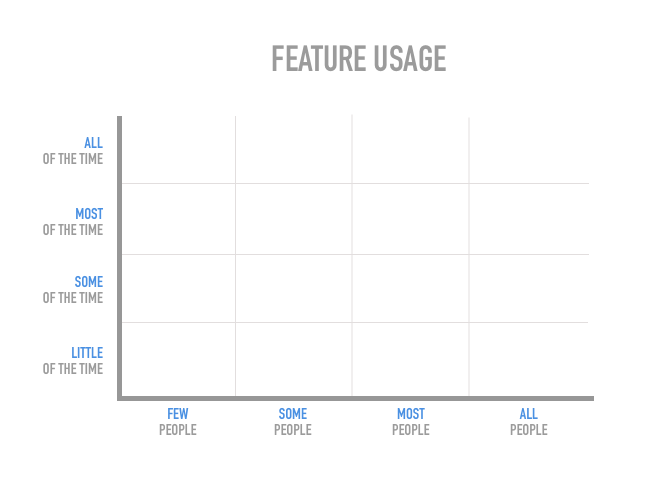
The horizontal axis will consists of few/some/most/all customers using this feature.
The vertical axis will consist of this feature being used little/some/most/all the time per customer (e.g. this feature has been used 10 times on average by each user)
Doing this for every major feature in your product will create an "audit" of the features in your product, which are popular, and which are not.
Cohort analysis
Dictionary.com defines a cohort as "a group of people with a shared characteristic." You can think of this as a group of people who experienced a common event like being born in the same year or graduating from Havard Law in 2005.
The type of cohort that affects product managers is based on the dates when people first sign up for your service.
Let's say that you release your product on May 1st, do another big upgrade on June 1st, and a final one on July 1st. The users who sign up in May are "experiencing" the May product and its set of features. The users who sign up in June are "experiencing" the June product and its set of features. If the latter set of users (the June cohort) display better metrics (e.g. spend more money per user), then you can attribute that to the product (and its set of features) being better in June than in May.
If you release one feature in June, and revenue increased by 5% for the June cohort of users, then this suggests that this feature "explains" the increase in the revenue metric. For this reason, cohort analysis is useful because when you see changes in metrics and deduce what caused it, and adjust your product accordingly.
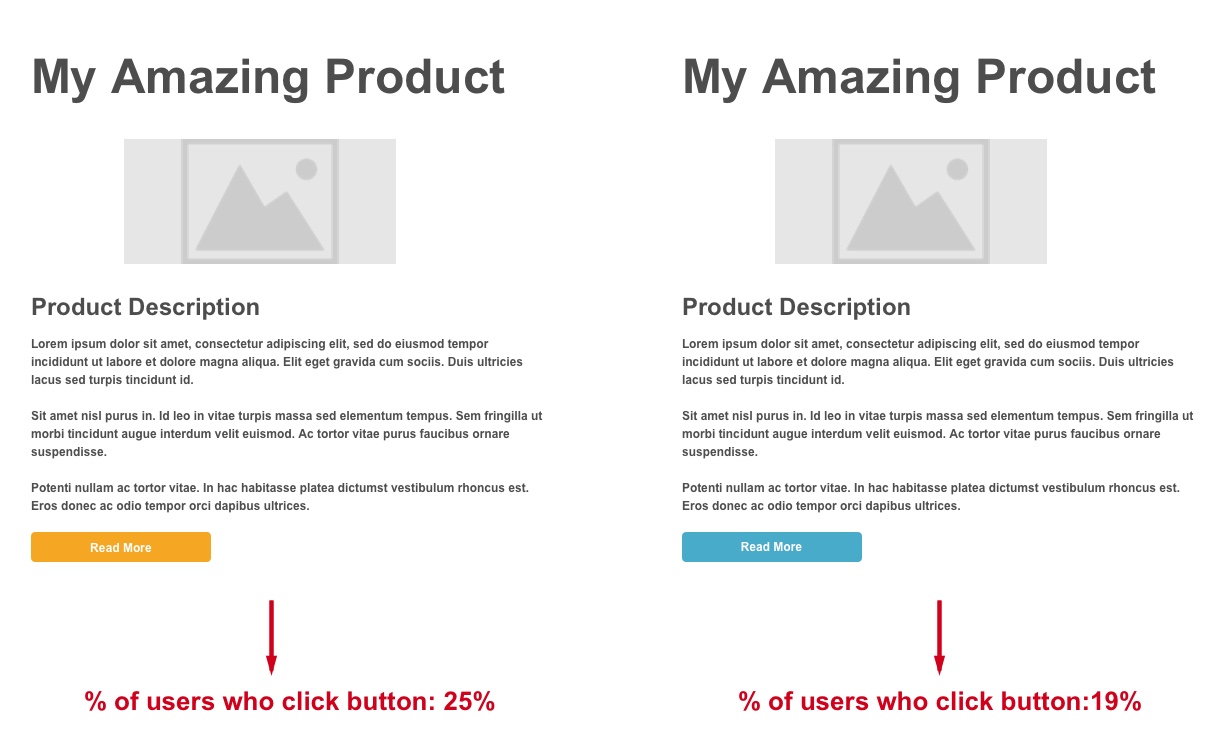
A/B tests
An A/B test is a controlled experiment that has two variants called A and B.
The goal of an A/B test is to improve a specified metric. The idea is that A and B are identical in every way except one. For example, A is a web page with a green button, and B is exactly the same web page, but the button is blue. Thus, by subjecting some users to variant A, and some other users to variant B, you can measure and see which variant performs better.
Principles of good metrics
Alistair Kroll & Ben Yoskowitz, authors of Lean Analytics, share some rules of thumb for what makes a good metric. A good metric is:
Comparative - Try to compare your metric to other time periods, groups of users, or competitors to help you to understand the trend and direction in which things are moving.
Understandable - If people can't easily have a discussion about a metric, get confused, or have a hazy understanding of it, then it will be difficult for it to be actionable.
A ratio or rate - Since ratios are inherently comparative, looking at a daily metric over 30 days, you'll see if there is a sudden spike, a general trend, or just noise. This is far more useful than a vanity metric like "total number of users."
Actionable - A good metric changes the way you behave. When your actions raise the metrics that you care about, you are likely to do more of them since you can see their virtue.
Summary
A metric is a measure for qualitatively assessing a process or event.
You need to examine metrics to measure whether a feature was successful. If it wasn't, you may need to tweak it until you get the desired results.
Three tools that you can use to check the performance of a feature:
Feature audits
Cohort analysis
A/B tests
Additional resources
Read more on Feature Audits on the Intercom product blog.
