Write a Project Plan
In the last chapter, you saw how to break project requirements into a set of tasks.
Once you know who will work on each task and how long it will take, then you can put together a project plan that will allow you to track progress. Very simply, create a project plan, and the planning phase can then move into the executing phase of the project management lifecycle.
Discover Gantt Charts
There are multiple ways and tools to make a project plan. But one of the most common and complete formats is a Gantt chart. Invented by William Gantt, it is a type of bar chart that shows a visual representation of a project plan.
In a Gantt chart, you can understand timelines at a glance, as you can easily incorporate and visualize:
Tasks dependencies
The critical path
Milestones
A Gantt chart is structured in the following way:
Tasks are listed vertically - one row represents a task.
A horizontal bar represents a task.
The width of this horizontal bar represents the duration of the task.
The left-hand side of the bar shows the calendar day that the task is to begin. The right-hand side of the bar shows the calendar day the task is to be completed.

Tasks Dependencies
Sometimes you must complete one task before beginning another. Examples of this could be:
A tester cannot test a feature until developers finish building it.
An engineer cannot build a new web page until the graphic designer gives them the designs in Photoshop.
Having to complete one task before starting another is called task dependency.
You should only schedule project tasks in your plan after all other dependent tasks have been completed.
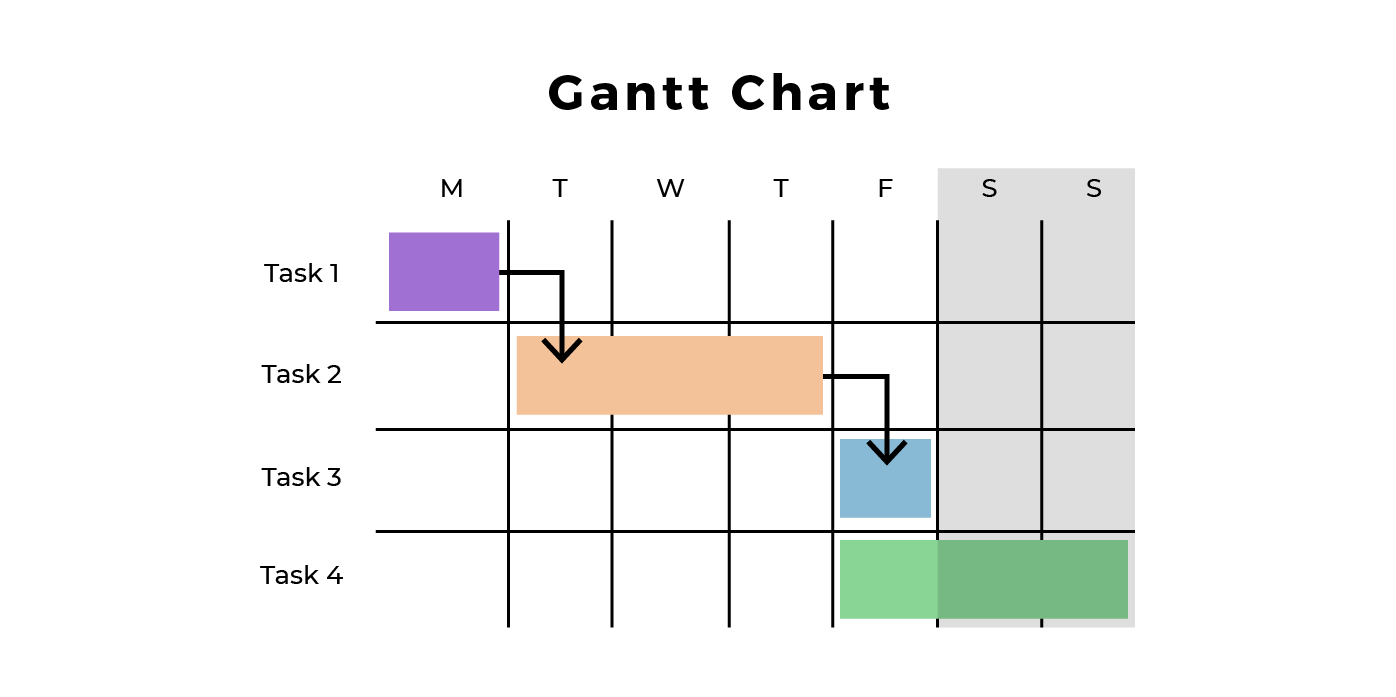
Indicate dependencies in your Gantt chart. This can be done by using an arrow. For example, in the chart below, the arrows tell you that it is only possible to start Task 2 once Task 1 is complete and that it is only possible to start Task 3 once Task 2 is complete.
Critical Path
A critical path is the longest path of tasks between the start and end of a project. If you order tasks so that each one only begins after any dependent tasks are complete, then the longest path will tell you the shortest time this project can be completed.
You can identify a project's critical path in the following way:
List all the tasks in the project.
Note the duration of each task.
Order the tasks so that any dependent ones are scheduled after those tasks are complete.
Identify the longest path from start to finish (i.e., the path with the longest time necessary to complete the tasks in that path).
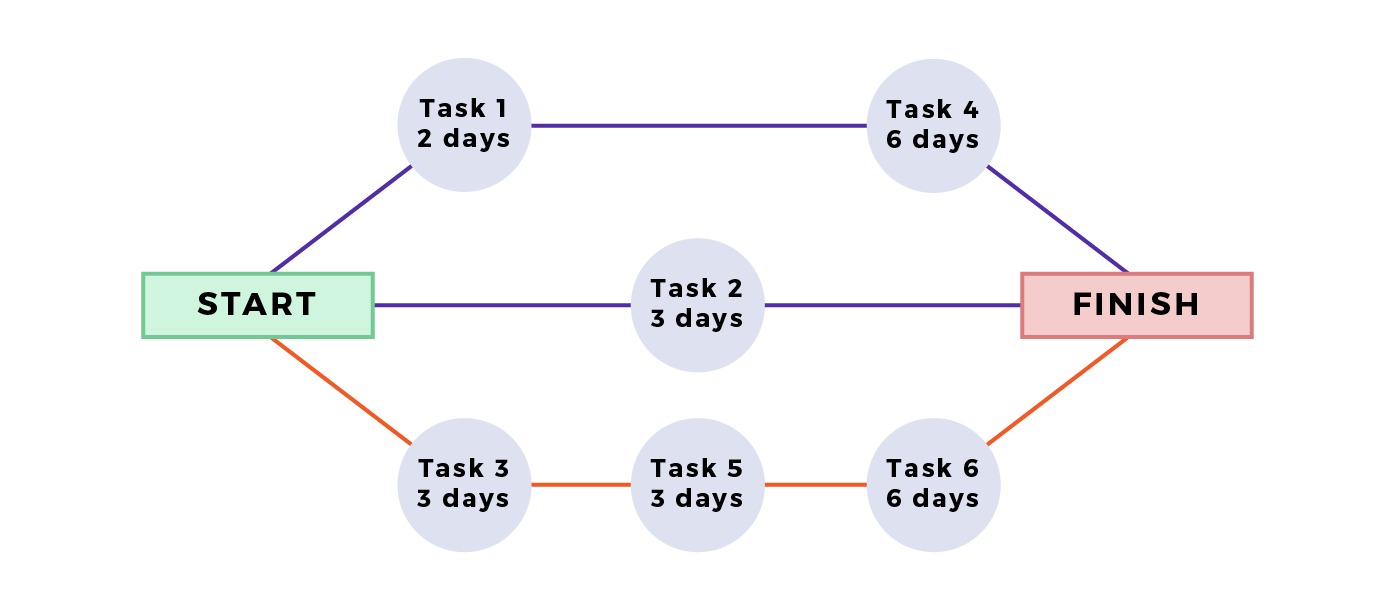
In the chart below, you can see the critical path denoted in orange. The longest path (Task 3, 5, then 6) is 3+3+6 = 12 days. Tasks 3, 5, and 6 are on the critical path, so the project duration will be 12 days.
The critical path is useful in the following ways:
Project managers care about the critical path because they know that if a task is delayed by one day, the project’s end date is also delayed by one day. In the illustration above, the orange path will take 12 days (critical path). If Task 6 took seven days instead of six, the project would take 13 days instead of 12. If a task on the critical path is delayed, the entire project is delayed.
A late task not on the critical path does not necessarily delay the entire project. For example, if Task 2 takes five days instead of three, the entire project can still be delivered in 12 days.
For this reason, a project manager will often assign their most effective and experienced people to complete tasks on the critical path. They know that these tasks potentially have the largest impact on the project's deadline.
If the project must be shortened for some reason, then the project manager will need to shorten the time spent on the critical path tasks. The project can only be shortened by reducing the critical path.
As software development author Fred Brooks remarks:
How does a project get to be a year late? One day at a time.
Milestones
Wikipedia defines a milestone as:
a tool used in project management to mark specific points along a project timeline.
Milestones highlight crucial moments of a project’s progress. Key decision-makers may not track daily progress, but they will want to see that major milestones are reached. Milestones are also used as a time for external review and quality assessment. In some cases, a review can prompt an increase in the budget if needed to continue the project.
The project plan’s author should choose milestones carefully. The determined events will help the team stay focused on meeting targets. Therefore, selecting critical events that the whole team can strive to achieve is essential.
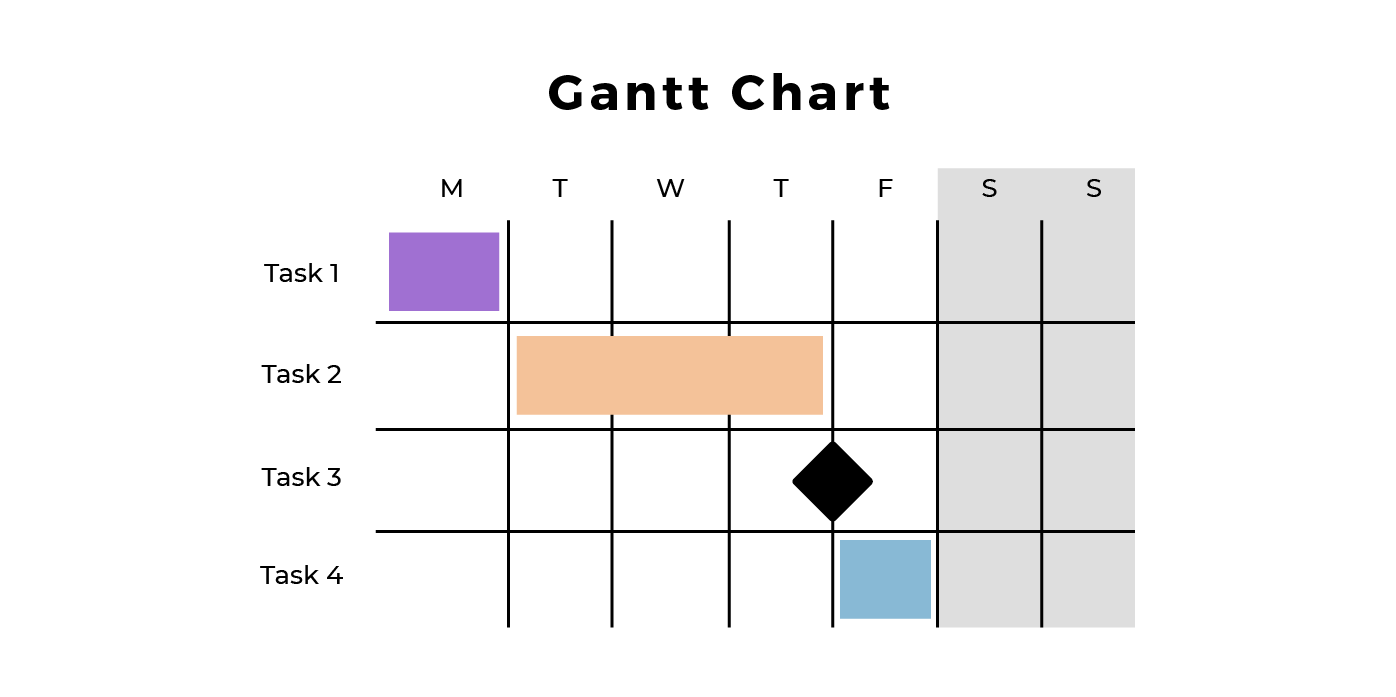
Milestones should be clearly visible on a Gantt chart.
Typically, they are denoted as a diamond and have a row of their own to make them clearly visible.
Now that you have learned the concepts of task dependency, critical path, and milestones, you can incorporate these into the project's Gantt chart. The chart will help create a visual representation of the tasks you must finish to complete the project. It will help you monitor project progress and understand if you are making sufficient progress as the project unfolds.
Let’s Recap!
A Gantt chart is a type of bar chart that shows a visual representation of project planning and project progress.
A task dependency is when one task cannot start until another is finished.
Critical path is the longest path of tasks between the start and end of a project. It tells you how long the project will take.
Milestones are specific points on a project timeline that highlight important moments of progress.
Now that you have a visual plan of tasks it will be easier to track their completion in the execution phase. Let’s find out about this phase in the next chapter. But first, take the quiz!
