Debug your function
Why isn't this working?!
When something goes wrong in your project, figuring out what happened can be tricky. Here are a few techniques that will hopefully help you get things sorted!
Console logs…so many console logs…
The console is an incredibly useful tool when it comes to debugging code. Let's have a look at a buggy version of a function from a previous chapter:
const getWordCount = (stringToTest) => {
  const wordArray = stringToTest.split('');
  return wordArray.length;
}
For some reason, this function returns some weird values. Let's use a console log see what's going on:
const getWordCount = (stringToTest) => {
  const wordArray = stringToTest.split('');
  console.log('Word array in getWordCount: ');
  console.log(wordArray);
  return wordArray.length;
}
Now, when making the following call, we get the following result in the console:
getWordCount('I am a fish');

/* console shows:

"Word array in getWordCount:"
["I", " ", "a", "m", " ", "a", " ", "f", "i", "s", "h"]

*/
Instead of splitting the string into words, it's splitting it into letters! A closer look at the function shows a mistake in the split call: it should be stringToTest.split(' '), and not stringToTest.split('').
Using the console is fine in small, simple, isolated cases like this, but in more complex projects, it would be much harder and time-intensive. For those situations, we need some bigger guns.
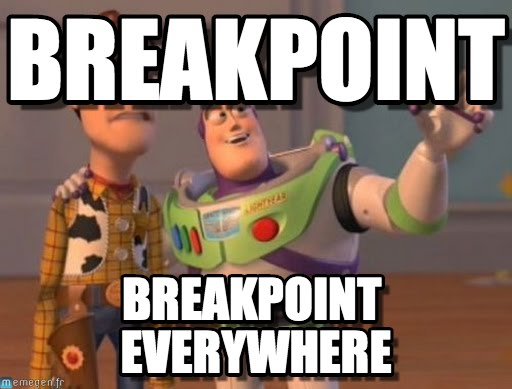
Developer tools
When writing JavaScript for web sites, you can use the developer tools integrated into all four major browsers: Chrome, Firefox, Safari, and Edge. Each browser contains a system which allows you to add breakpoints to your code. When the browser comes across a breakpoint in your code, it pauses execution, allowing you to step through execution line by line, checking the values of all variables at each step. You can even skip certain pieces of code if you want to see how your app reacts to that.
Most IDEs also come with a debugger, allowing you to debug everything from your workspace. This can come in handy, especially if your code won't be running on a web page and cannot be checked in the browser. Popular IDEs include Visual Studio Code (free) and WebStorm (monthly fee, free for some students).
Console logging is fine, debuggers are better, but when all else fails, there is:
Rubber duck debugging
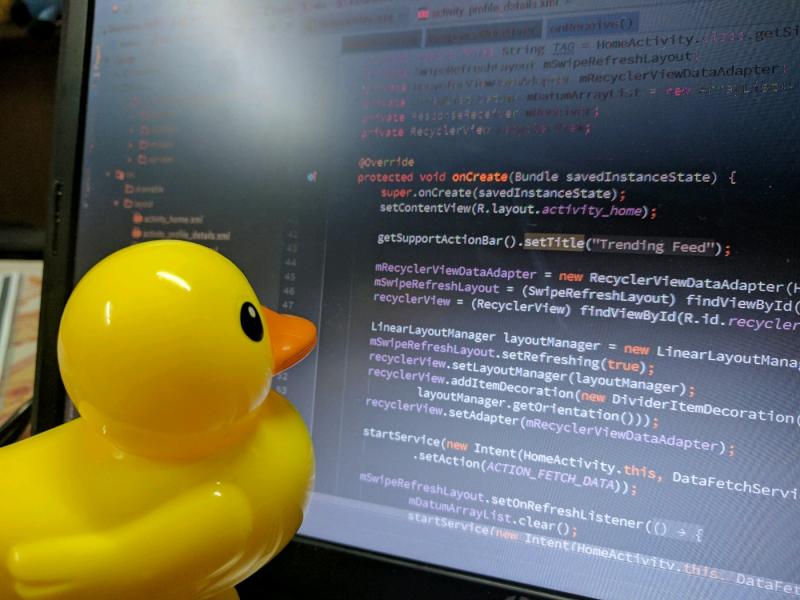
When your code has a bug you can't find and explain, you talk to a rubber duck you keep on your desk. You explain your code line by line using simple terms the duck can understand. The process of thinking out loud and explaining your code in simple terms often ends with you saying, "How did I not see that? There's the bug!"
While this section is a little tongue in cheek, the act of reasoning about your code, out loud and in simple terms, can be helpful with debugging and refactoring. Something to bear in mind!
Let's recap!
In this chapter, you learned three different debugging techniques:
Console logging — great for small, simple, isolated errors, but not so great in larger, more complex projects.
Using developer tools — whether the tools integrated in major browsers or the debugger in your IDE, this is almost certainly the most reliable way to debug code.
Rubber duck debugging — for when things are going horribly wrong.
In the next chapter, we will look at a kind of function which, when used properly, can drastically improve project performance.
