Fix a bug
Debugging
As you write your application, you want to make sure that everything is working properly. Unfortunately, sometimes things don't go according to plan. When that happens, you need to understand why by reviewing what you just wrote and figuring out what went wrong.
But, why stare at your code for hours? Fortunately, Visual Studio has a built-in debugger. It won't find the bugs for you, but it will let you step through your code one line at a time to understand what's going on. You can see how your code flows from one place to another, view the current state of any variable, and get helpful information if an error occurs.
Setting breakpoints
Debugging allows you to set breakpoints. You can use them to pause the debugger at various spots within your application. Otherwise, you would have to go through your code line-by-line from the very beginning which would take a very long time if the area you want to verify is deep within your code.
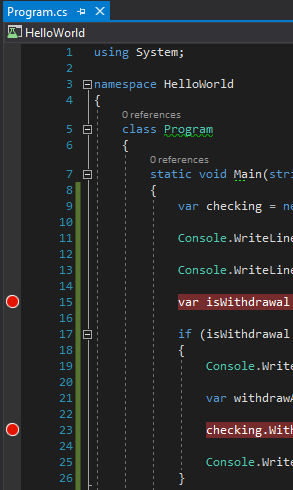
In Visual Studio, you can set breakpoints by clicking on the left column of the main code window. This adds a red dot and highlights the associated line of code in red. In the figure below, two breakpoints have been set at lines 15 and 23, where the debugger will pause to let you review what values are being set and passed.
To start the application in the debug mode, either select Debug > Start Debugging from the Main menu or click on the green play button for HelloWorld:

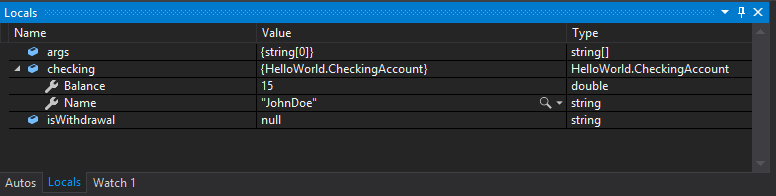
When the debugger pauses on a breakpoint, you can see the current state of your application from the Debug windows at the bottom of Visual Studio. For example, in the Locals window, you can see the name, value, and type of all the objects created. This window will update each time we step through a line of code.
To continue on from the breakpoint, use either the Step Into or Step Over buttons.
The Step Into button
 is used to enter a function call on the current line and step through its contents.
The Step Over button
 is used to pause after a function call executes.
To stop a debug session, click on the Stop Debugging button.


In the video below, let's set a couple breakpoints and then step through the application in the debug mode. Then, we'll review what is displayed in the debug window.
As you saw from the video, we stepped through the application that was running correctly. But, what happens if you encounter incorrect output? In the next video, we will go through the application that contains an issue and use the debugger to locate the issue and fix it.
Let's recap!
The Debugger allows to you step through your code line-by-line as it executes.
Setting breakpoints allows you to pause the debugger at any given line of code.
The debug window displays current names, values, and types of objects as you step through your code.
Step into allows you to step through the lines of code inside a function call.
Step over allows you to skip the contents of a function call.
Use the F5 shortcut to enter the debug mode.
