Set breakpoints
Add a number of breakpoints
Let's go back to the investigation launched in the previous chapter. We need to pause the execution before the call to the CreateTask method in line 19 of the T_TodoModel.cs file for the VerifyAddTasks unit test.
A breakpoint can be set up in several ways:
Click in the margin of the line.
Right-click Breakpoint | Insert Breakpoint on the instruction:
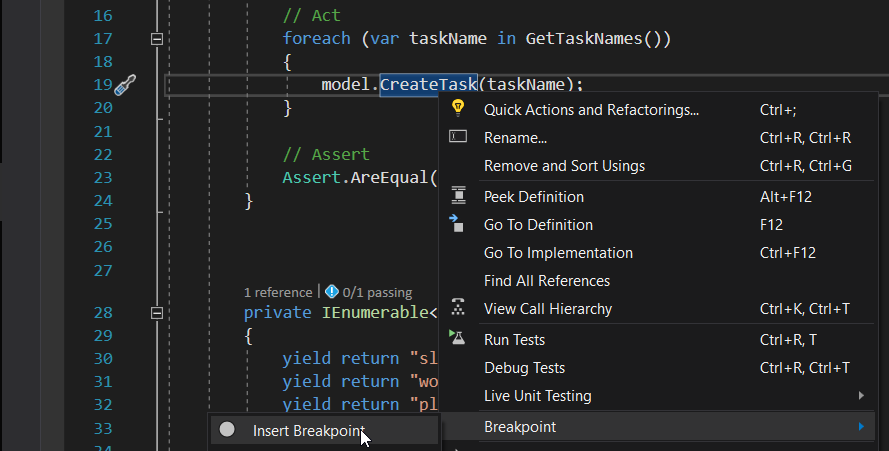
You can also use the keyboard shortcut F9 in the code editor with the cursor on the instruction.
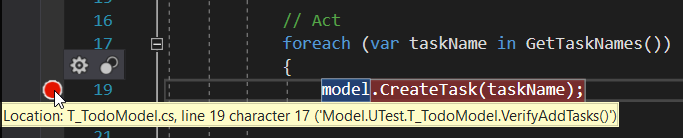
The instruction in question appears in red in the code editor, and a red dot indicates this in the margin:
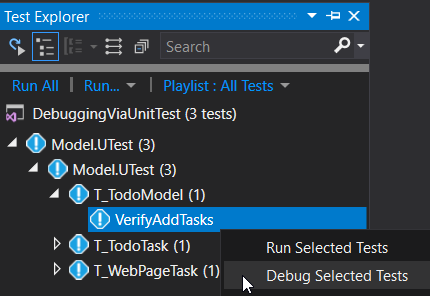
Once the breakpoint has been set up, let's start debugging the unit test using the Test Explorer interface with a right-click | Debug Selected Tests:
In this way, the selected test starts up under the control of the debugger. The .NET framework notifies the Visual Studio debugger of certain events like detecting a breakpoint.
As expected, execution is paused:
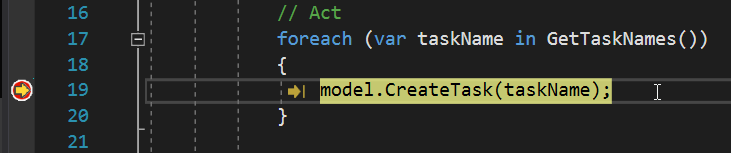
The yellow arrow represents the execution pointer, which indicates the next instruction to be executed. This yellow arrow also appears on the left of the editor in the breakpoint’s red dot.
Managing your breakpoints
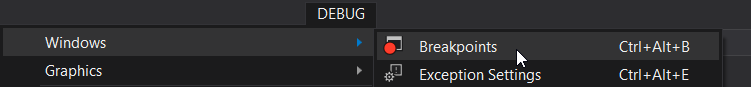
When you are investigating, you may have to define several breakpoints. Visual Studio offers a graphical interface for asking the debugger to ignore them temporarily or delete them. You can access this list of the defined breakpoints from the Debug | Windows | Breakpoints menu:
If you want to retain some breakpoints without the debugger taking them into account, all you have to do is uncheck the box, like the last two breakpoints in the screenshot below. The dot loses its red fill to indicate the status of the disabled breakpoint:
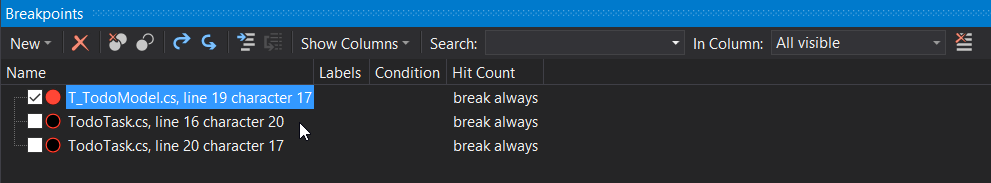
If your current theory isn't right, this allows the execution to proceed more smoothly, without losing reference points.
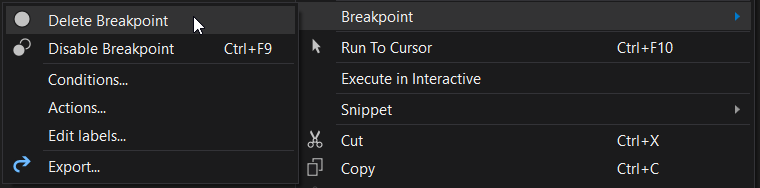
There are several ways to delete a breakpoint you no longer need::
Select the breakpoint in the Breakpoints panel, and click the red X on the toolbar.
Use the keyboard shortcut
F9on the line, directly in the code editor.Click on the dot in the margin or right click Breakpoint | Delete Breakpoint.
Let's recap!
You now have the means to pause your code execution at critical places. However, there are instances where want to trigger these breakpoints not systematically, but under certain conditions: you’ll see how to do exactly that in the next chapter. 😉
