Understand How K-means Clustering Works
What is clustering?
Clustering is an unsupervised learning method which finds an underlying structure in a set of data points by grouping the data points based on their similarity.
Why do we want to study the data structure ?
In the example above, the first graph tells us that there is no correlation between the 2 variables plotted. In other words, knowing the value of one variable doesn't give us any information on the value of the other one.
In graph 2, however, we see that as one variable increases, so does the other one. Indeed, the structure gives us the relation between the variables.
In the 3rd graph, points are structured into groups. Here, the structure of the data tells us that individuals can be categorized according to 3 categories. This is precious information for a data analyst!
Why do we need it?
Data scientists are often presented with data sets with no discernable structure.
Before continuing in their analysis, the first thing a data scientist wants to gain is an understanding of the overall shape and structure of the data as well as a summary of what it contains.
Clustering can help gain that understanding. Clustering also has many very useful applications in data analysis, for example:
Customer segmentation
Consider, for example, a list of customers that contains information about their spending history, location and hobbies. Clustering can find implicit groups within the list. The groups can be described by their variables and can be used to identify target individuals for specific marketing campaigns.
Crime profiling
Criminal events can be analyzed using clustering techniques to group similar crimes and identify crime hotspots.
Image sorting
Imagine you acquire a set of thousands of image files that you need to sort through. Clustering can be used to find groups of similar images so you can start to understand the general types of images you have.
Clustering approaches
There are numerous clustering algorithms. In this course we will investigate just two: k-means and hierarchical.
How k-means works
Let's first look in-depth at how k-means clustering works. The algorithm is very simple:
Specify k, the number of clusters you want
Select k random centroids
LOOP
    Assign all data points to the nearest cluster centre
    Move the centroids to be centre of their clustered points
UNTIL centroids haven't moved or we've performed a maximum number of iterations
Let's see how this works with an example.
One dimension
Let's start by looking at clustering in one dimension (i.e. where we have just one variable). Take a look at the data points below:

If asked to group the dots into 3 groups, using your eyes, you can probably distinguish 3 distinct groups of dots. But how can we get a computer to "see" this?
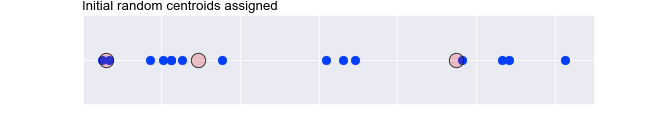
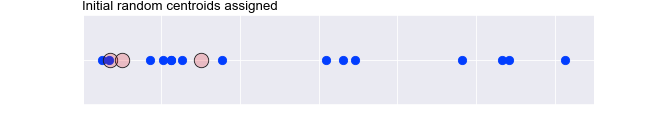
K-means works by first selecting a set of random points. We call these centroids because they are going to be the centres of our groups. Let's say that we decided to look for 3 groups in the data points above. We would select 3 points on the line at random, denoted by the larger outlined circles below:
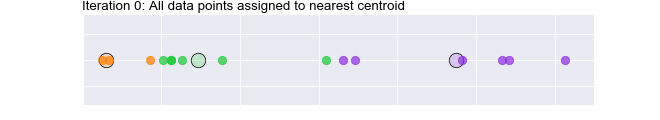
Then, for each data point we assign the point to the nearest of the centroids. These are denoted below using different colours:
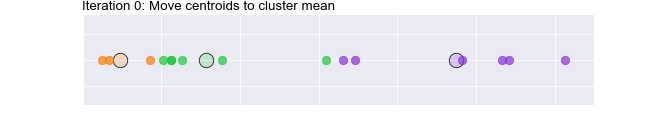
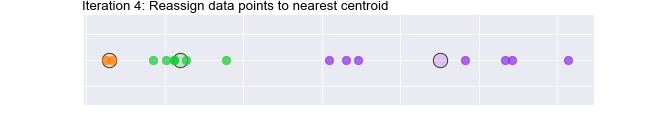
Next, we move the centroids so they are at the mean of the data points in their group. You can see that the green and orange centroid have moved to the right:
At this stage, we may find that some of our data points are no longer assigned to the closest centroid, so we reassign them accordingly. You can see that one of the green points has turned orange:

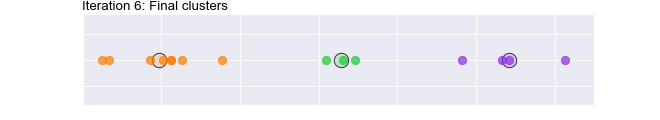
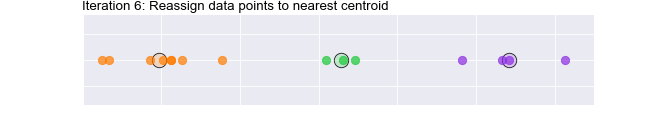
We repeat this process of moving the centroid and reassigning the data points until the centroid stops moving. The following animation shows this process in action:

Finally, we end up with these centroids and clusters:
It's worth pausing and thinking about how we selected those initial 3 centroids. We did it randomly! What if we select a different set of random points? Will we get to the same result? Let's see!
First, select a different set of random points:
Now let's run through the process. Watch the following animation:
So, with the first set of random points we ended up here:
With the second set of random points we ended up here:
We ended up with different clusters when we chose different initial centroids! Using our human judgment, we would probably say that the first clusters were better. Fortunately, we can compute a measure of how well the clustering was performed by summing up the variance across all the clusters. We are aiming for low variance, which shows we have nice tight clusters. Hopefully, you can see that the total variance (denoted by the length of the colored lines) for the 3 clusters is smaller for run 1 than run 2:
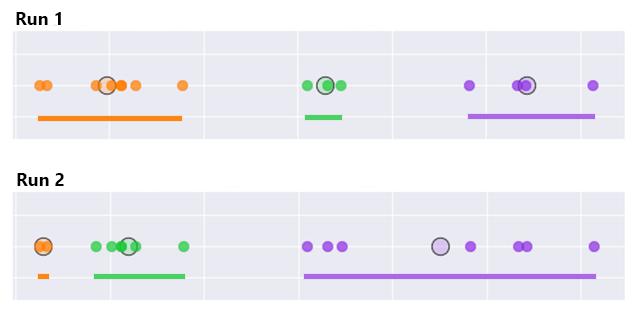
The k-means algorithm, therefore, makes a few runs of the above process and chooses the result that has the lowest total variance.
Moving to 2 dimensions
Again, thinking back to what we discussed during the PCA part of this course, we saw that the vector maths works with however many dimensions our vector has. Similarly, we can be confident that k-means clustering works when we move up to 2, 3 or more dimensions (i.e. 2, 3, or more variables).
Let's take a look at it working in 2 dimensions. Watch the animation below to see how the initial random centroids are moved and clusters formed in 2 dimensions :
It's hard to visualise this for 3 or more dimensions, but we will trust the maths!
In the next chapter we will see how we can use scikit-learn to perform a k-means clustering with Python.
Recap
Clustering is an unsupervised learning method which finds an underlying structure in a set of data points by grouping the data points based on their similarity
It helps us find the overall shape and structure of the data as well as a summary of what it contains.
Two approaches to clustering are: k-means and hierarchical clustering.
