Review the Fundamental Vocabulary
Before diving into the content, let's first review some important concepts and vocabulary used in data science.
1) Data
Let's start with data. Data is the raw material from which we extract information.
A dataset is information about a population. Information is gathered about each sample of the population in the form of its characteristics or variables.
For instance, we measure the age, height, and weights of 300 school children. Each sample corresponds to a child, and the recorded variables are the age, the weight, and the height of each child. A dataset is a spreadsheet where the rows correspond to the samples and the columns to the variables.
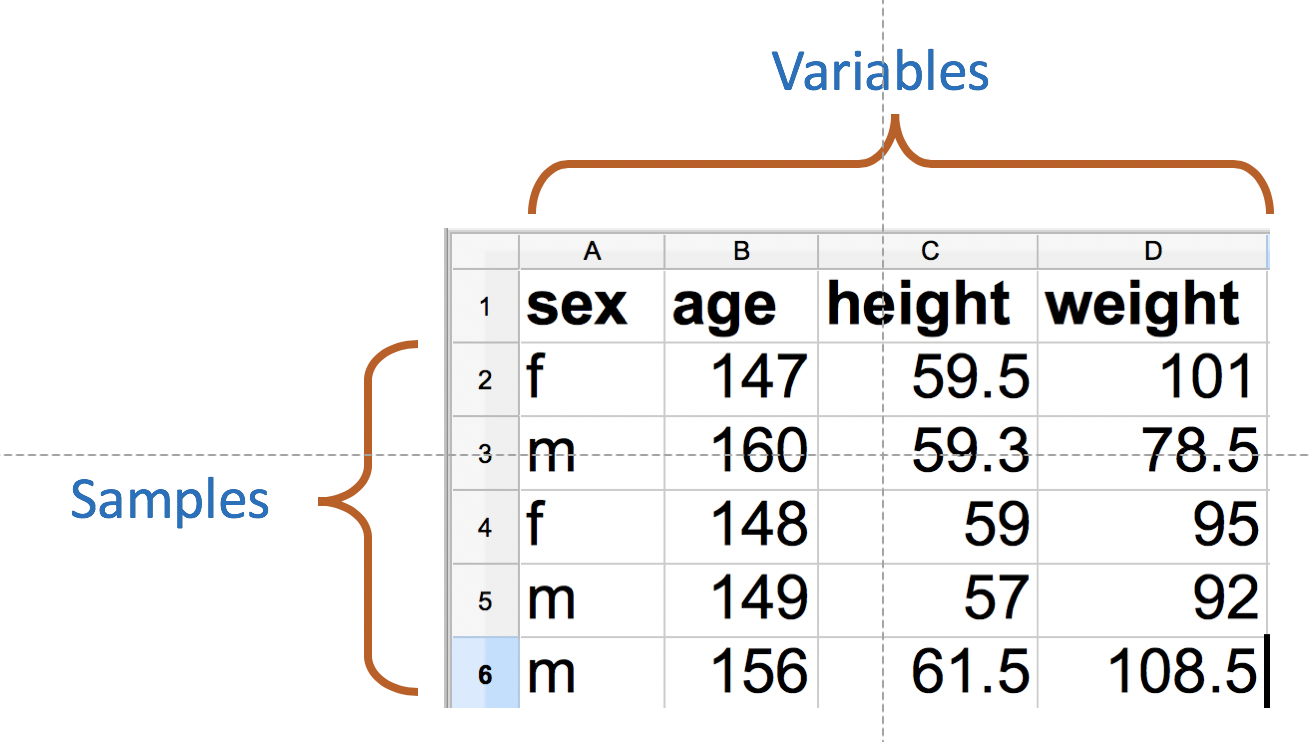
The important words here are variables and samples.
Among all recorded variables, we choose a specific one as the outcome variable, and we want to know how others influence it. To keep the same example, we want to understand how age and height influence the weight of children.
2) Statistical Modeling
Statistical modeling has been around for centuries. For real!
However, with the advancement of machine learning and artificial intelligence, statistical modeling has evolved. Two cultures are colliding: statistical modeling and predictive analytics.
Statistical modeling consists of building a model that best describes the real world (as illustrated by data). We use all the available data to create a model that explains the dynamics between the variables. The question is: How do age and height drive the children's weight?
On the other hand, predictive analytics consists of creating models that can be applied to previously unseen data to predict the outcome variable. Imagine we want to apply our model to children from another school to predict their weights based on age and height. The question is: Can we predict the children's weight given their age and height?
These two approaches are not incompatible, but as we will see, they use different techniques to exploit data and evaluate models.
3) Linear Regression
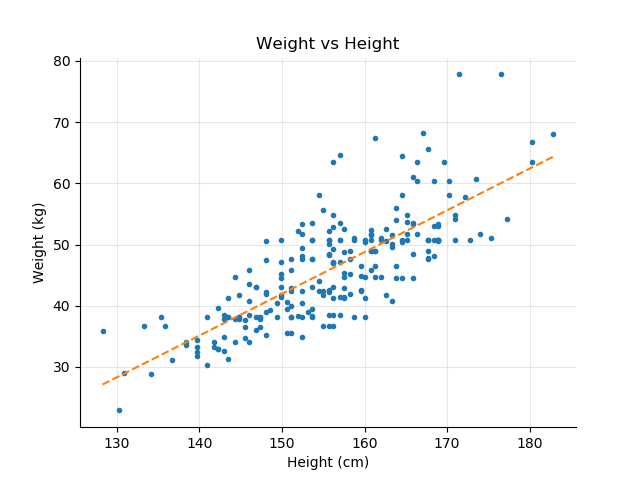
This course bridges the gap between the two approaches using the most powerful yet simple model, linear regression. Linear regression means finding the best line that fits the samples.
Linear regression is an amazingly powerful method for the following reasons:
It's very simple to implement. Linear regression is available on all the major statistical platforms, or scripting languages such as Python or R. You can even do linear regression in Excel!
It's simple to understand at first glance.
It's used for all types of problems, in many different fields, from marketing to healthcare.
Although linear regression works best for linear data, a term we'll explain in detail in the next chapter, it can also be modified and expanded to handle less regression-friendly datasets.
4) Variables....Calling a Spade a Spade
Statistical modeling is a vetted and ancient field used in many domains. As such, the vocabulary is also diverse. I know, this can be a little confusing. You will encounter many different names to describe the same thing. For example:
Predictors are also called:
Exog (caused by factors outside the system)
Independent
Features
Regressor
Factors
While the outcome variable can be called:
Endog (caused by factors within the system)
Dependent
Target
Regressand
5) Regression and Classification
An important distinction is made depending on the nature of the outcome variable.
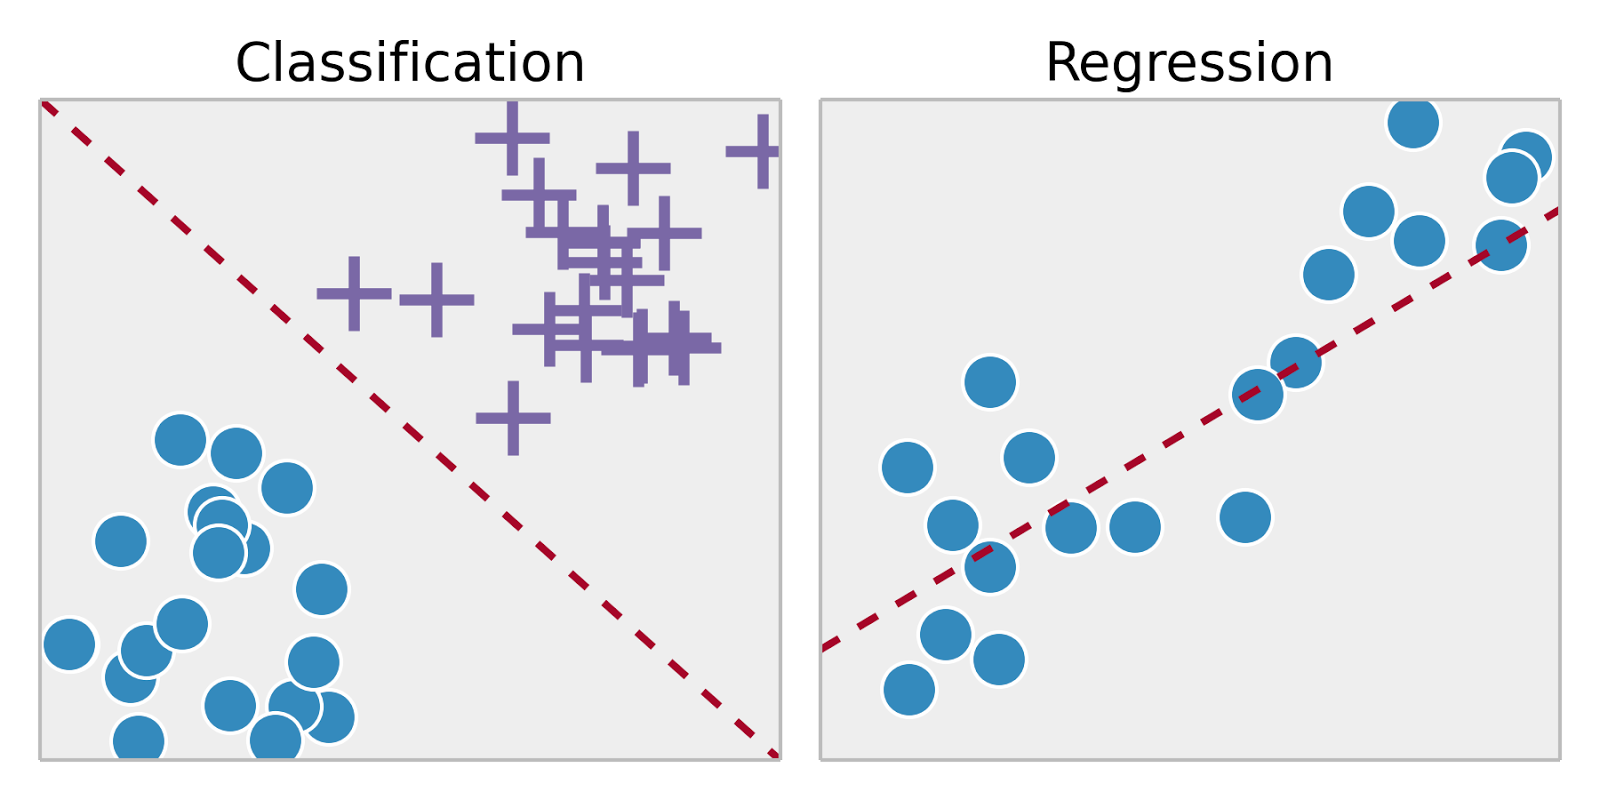
When the outcome variable is continuous and can take an infinite number of values, it's referred to as a regression problem. Examples of regression include modeling or predicting:
Prices
Plane delays
Online conversion rates
Income, weight, etc.
When the outcome variable is categorical and takes only a finite number of values, they are talking about classification problems. Examples of classification include modeling or predicting whether or not:
An online user buys, registers, or subscribes.
A person defaults on a credit.
A machine fails.
A student passes a test.
Examples of classification also include modeling or predicting:
Names of plants, animals, colors, brands, etc.
A ranked, star-based review on a product.
Binned continuous variables such as age groups: 0-10, 35-44, etc.
Course Organization
Now that you know the basics, let's talk about how the rest of the course is structured.
In Part 1, we lay the foundation for linear regression. We will discuss:
What linearity really means.
How correlation between variables is calculated and interpreted.
How to conduct a hypothesis test. Hypothesis testing is central to all statistical modeling, but particularly to linear regression.
In Part 2, we dive deeper into linear regression. We will discuss:
Univariate regression (one predictor) and multivariate regression (multiple predictors).
How to interpret the results of a linear regression.
Assumptions that the data needs to verify in order for linear regression to be relevant.
The math behind the ordinary least square method.
In Part 3, we expose linear regression to a heavy dose of radiation (;)) and make it mutate so it can handle classification problems and nonlinear datasets (Yes! We can apply linear regression to nonlinear data).
And in Part 4, we open the gates of predictive analytics. We will discuss techniques used to build strong, valiant, and robust models that can predict the future.
Without further ado, let's jump on the statistical modeling train by taking a good look at linearity!
