Combine Data in the Data Source Page
In this chapter, we will review the remaining sections (D, E, and F) of the Data Source page.
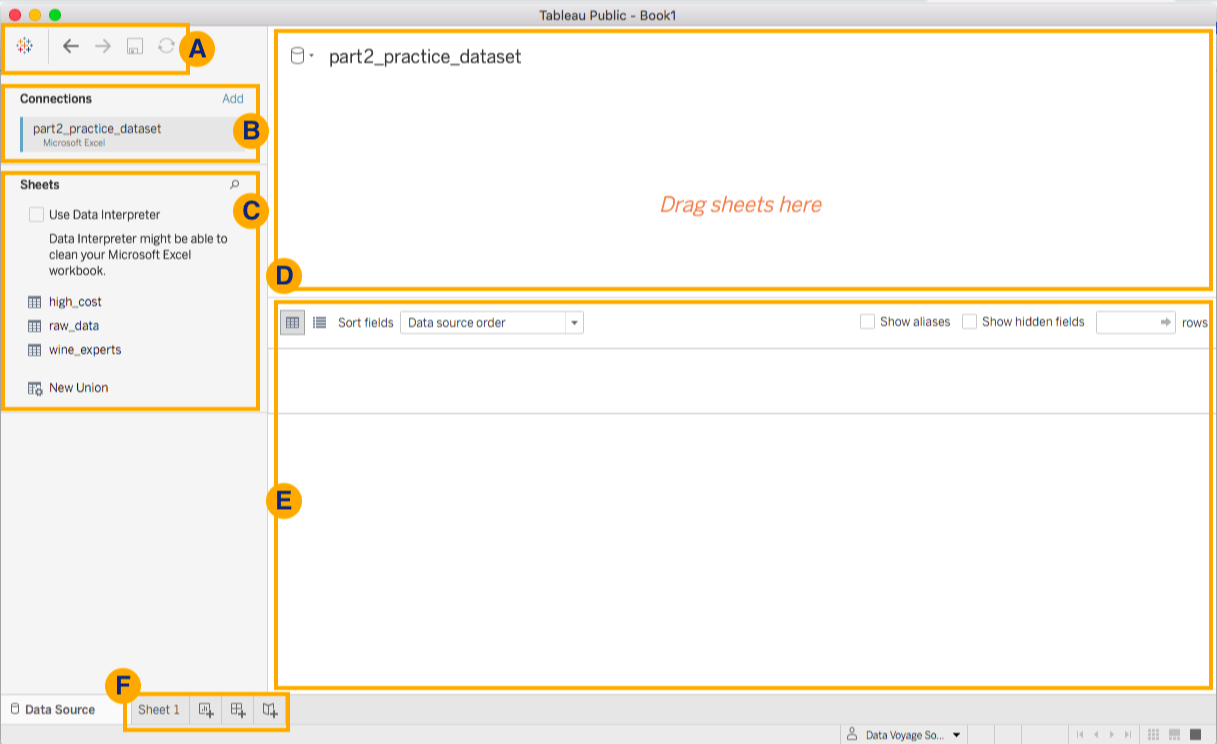
Sections D and E
You can think of Section D as a visual workspace for combining your data. Go ahead and drag the raw_data sheet into Section D.
Since we only have one table in this area, there is not very much to visualize at the moment.
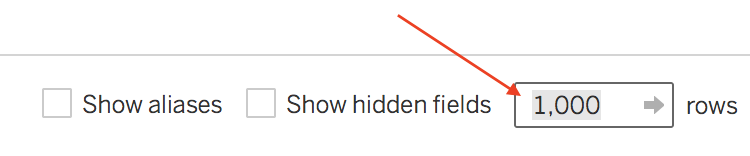
Before we bring in other tables into Section D, let’s check out the area below it (Section E). You can think of Section E as a data preview area. Here you get a preview of the table that you are loading as your workbook’s data source. You can see the fields (or columns) and the first 1000 rows in the data table. You can click on the number in Section E to change the number of rows that you are viewing in the preview area, as shown below. Take some time to get familiar with the data you have loaded into Tableau. Each row in the table contains data for a wine bottle review.
Combine Data in Tableau with UNIONS
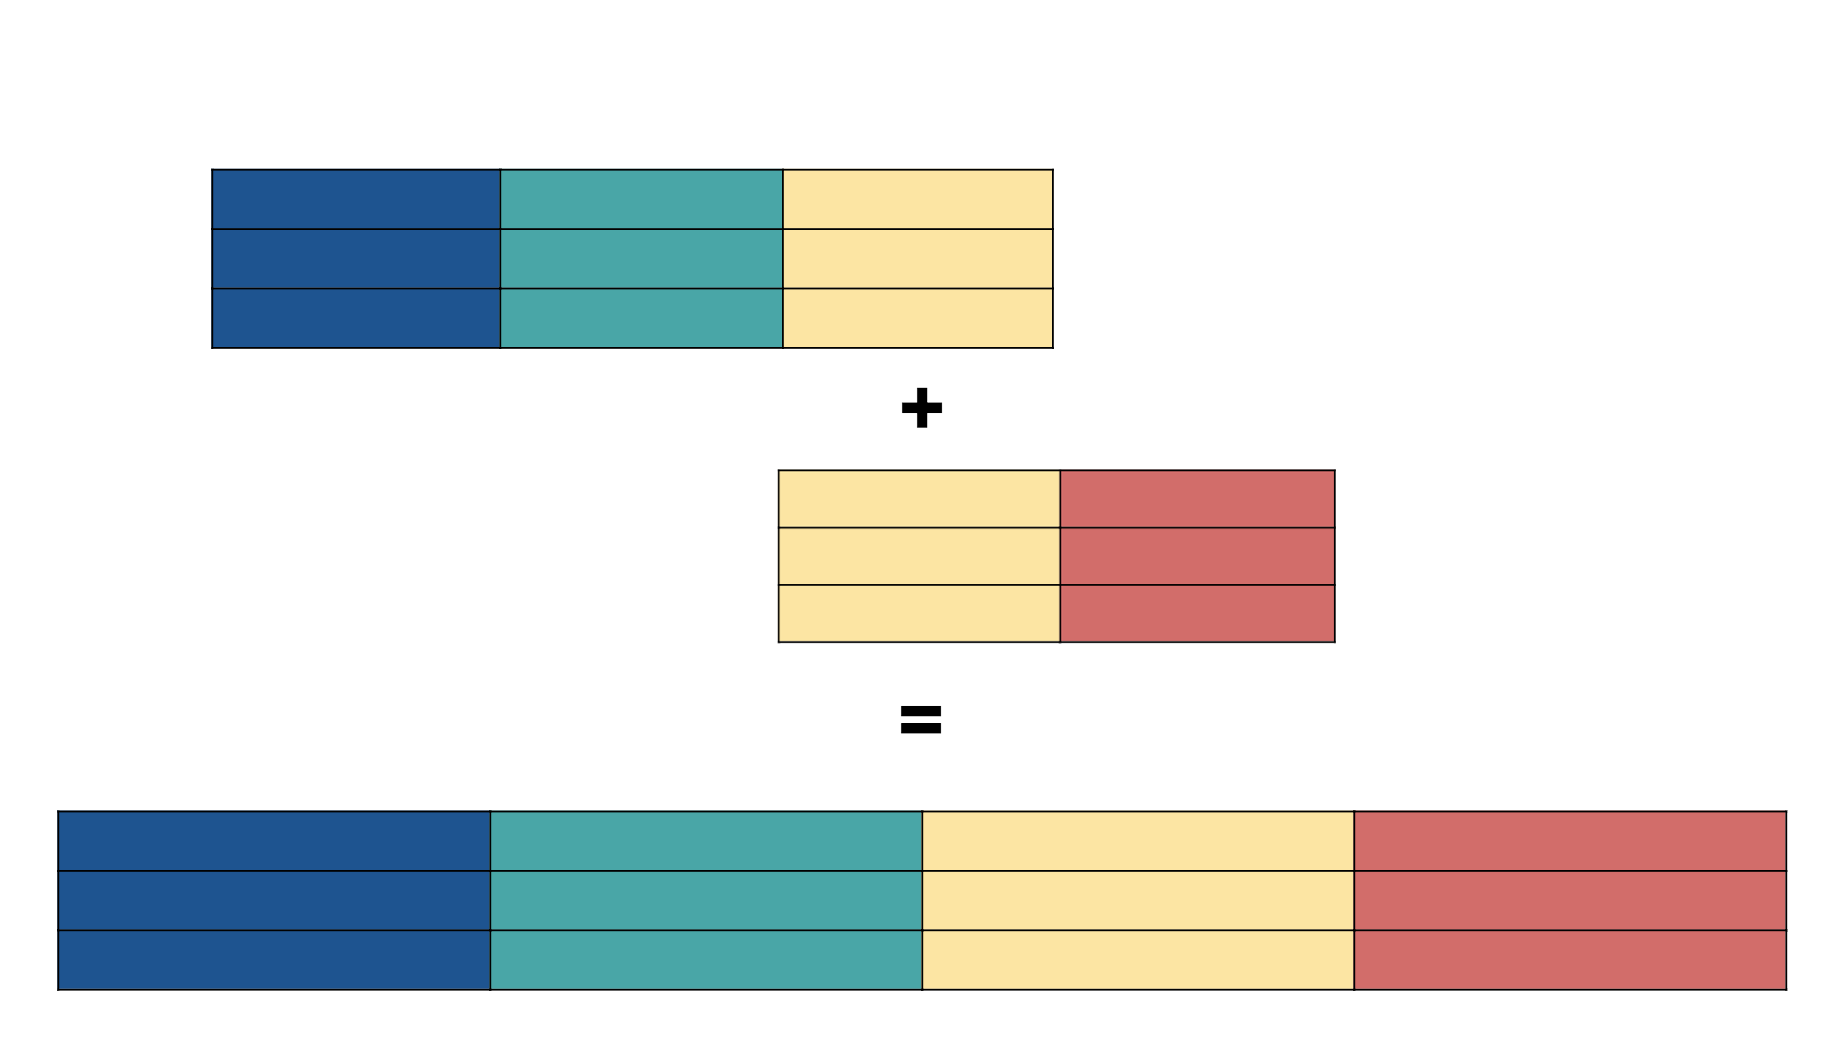
Here is a visual image of what a UNION looks like:
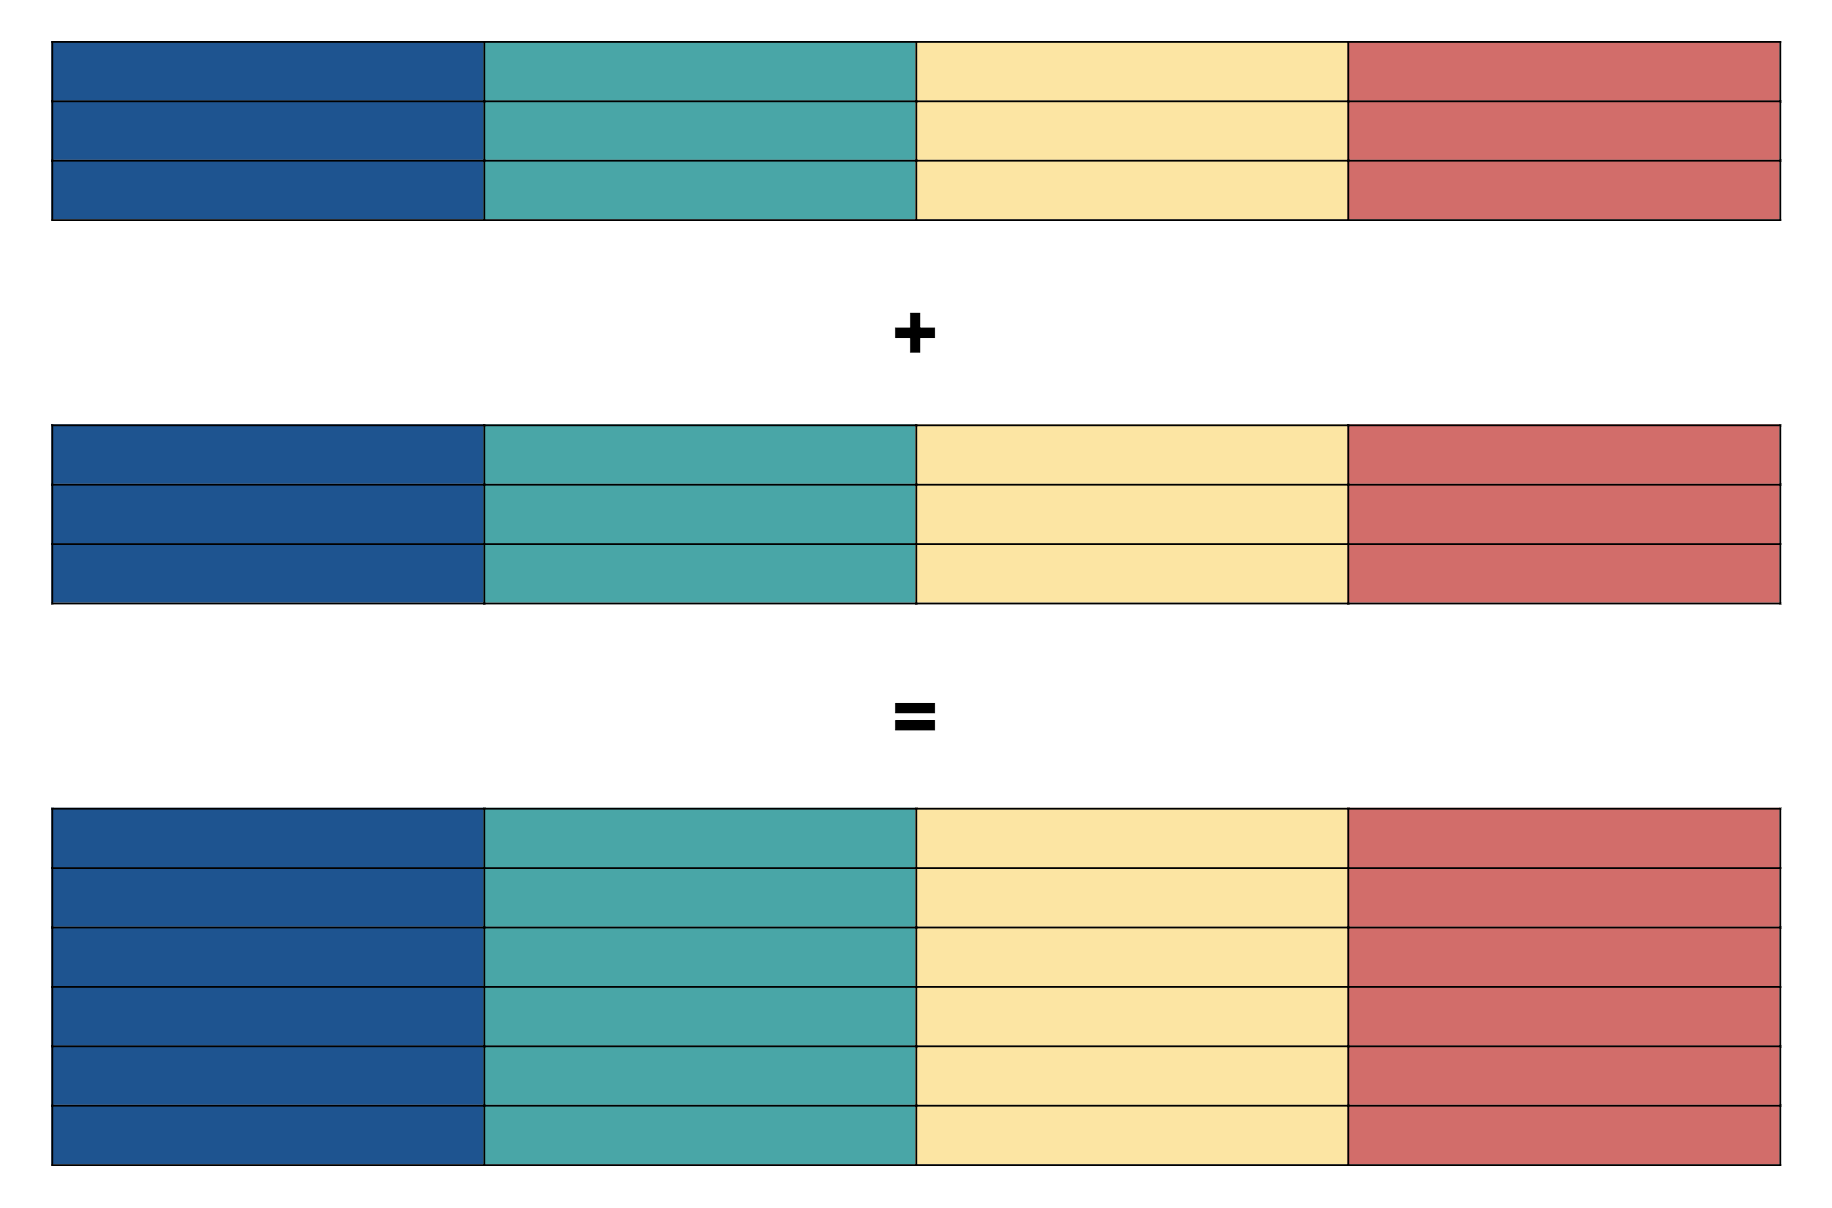
When you use a UNION to combine data, you are stacking tables. When you are stacking data tables, you will have one base table onto which you stack one or more tables.
For example, if you have sales data in quarterly data files, you will probably want to stack the data for quarters 2 - 4 onto the data for quarter 1, in order to have one complete dataset for sales.
Our base table is the dataset found in the sheet named raw_data. We are going to stack the data found in the sheet named high_costs onto raw_data. This way we have one data table for all wine bottle reviews in the dataset, including high-priced wines (found in the high_costs table).
Let's try that option out!
First, you need to clear out the visual workspace by removing any tables that are found in section D. Go ahead and drag out the raw_data table from Section D and drop it anywhere outside the section.
Once your visual workspace is cleared, drag and drop the New Union button into Section D, as shown below.
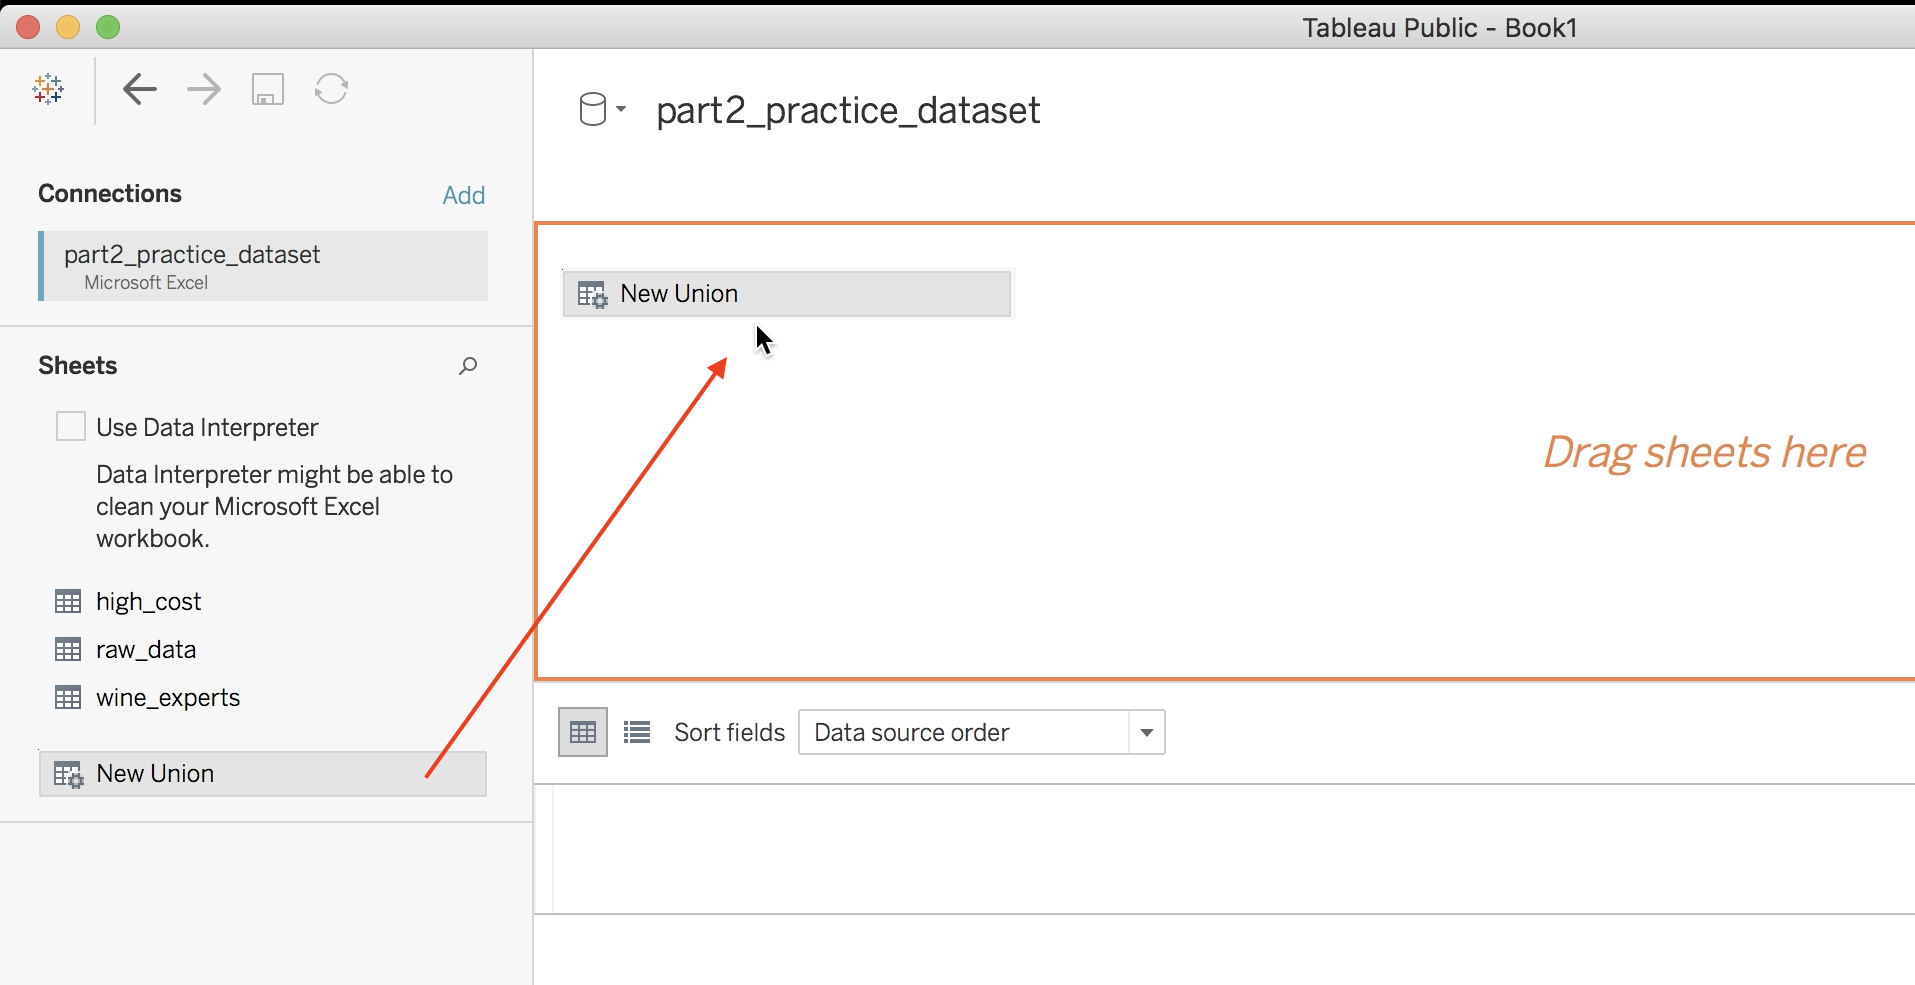
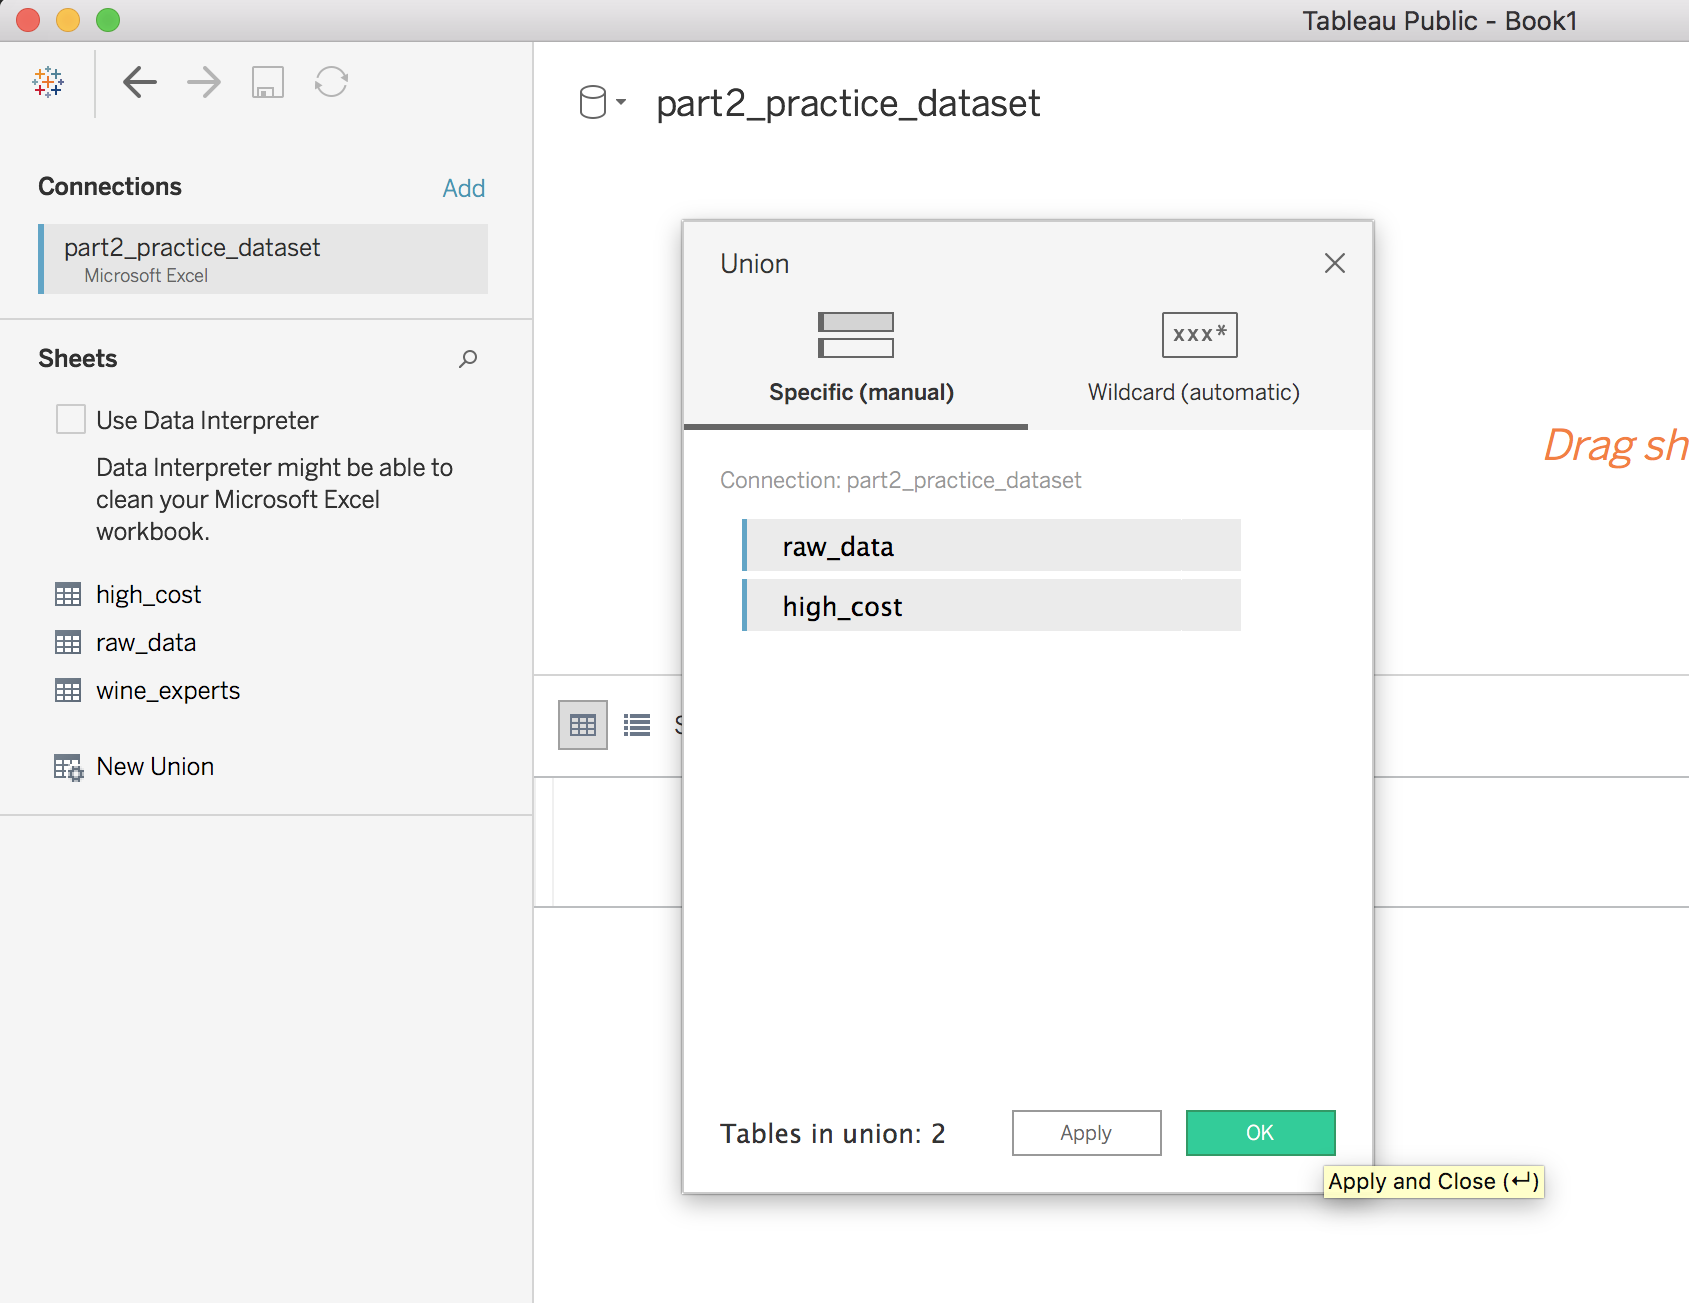
You should see a dialogue window pop up, as shown below. If you don't see this screen after dropping New Union to Section D, you probably just need to minimize your Tableau window to see it. Drag and drop the raw_data and high_cost tables into this dialogue window.
If you have problems creating a new union, have a look to this short video.
Merging Mismatched Fields
In the previous chapter, you learned about the View Data option in Section C. At this point, you saw that the column names of the first column in each table were different. Indeed, if you look at the data preview in Section E, you will see a column for Review_No and a column for review_id.
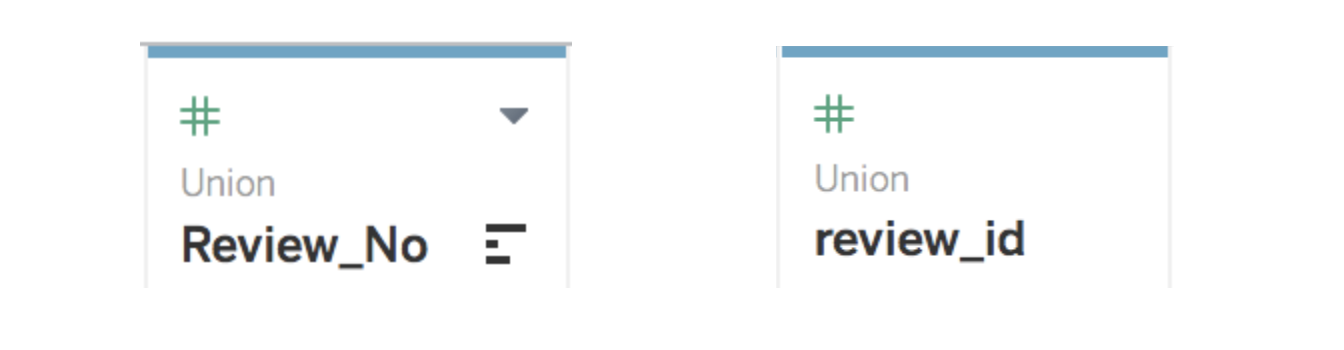
Even though these two columns are the same, Tableau interprets them as different in the resulting dataset (after the union).
To fix this, you first need to highlight both columns.
Then right-click on one of the highlighted columns, and select Merge Mismatched Fields.
Let's rename this newly merged field to review_id. First, right-click the newly merged review id column (or click the drop-down arrow for the column). Then select the Rename option.
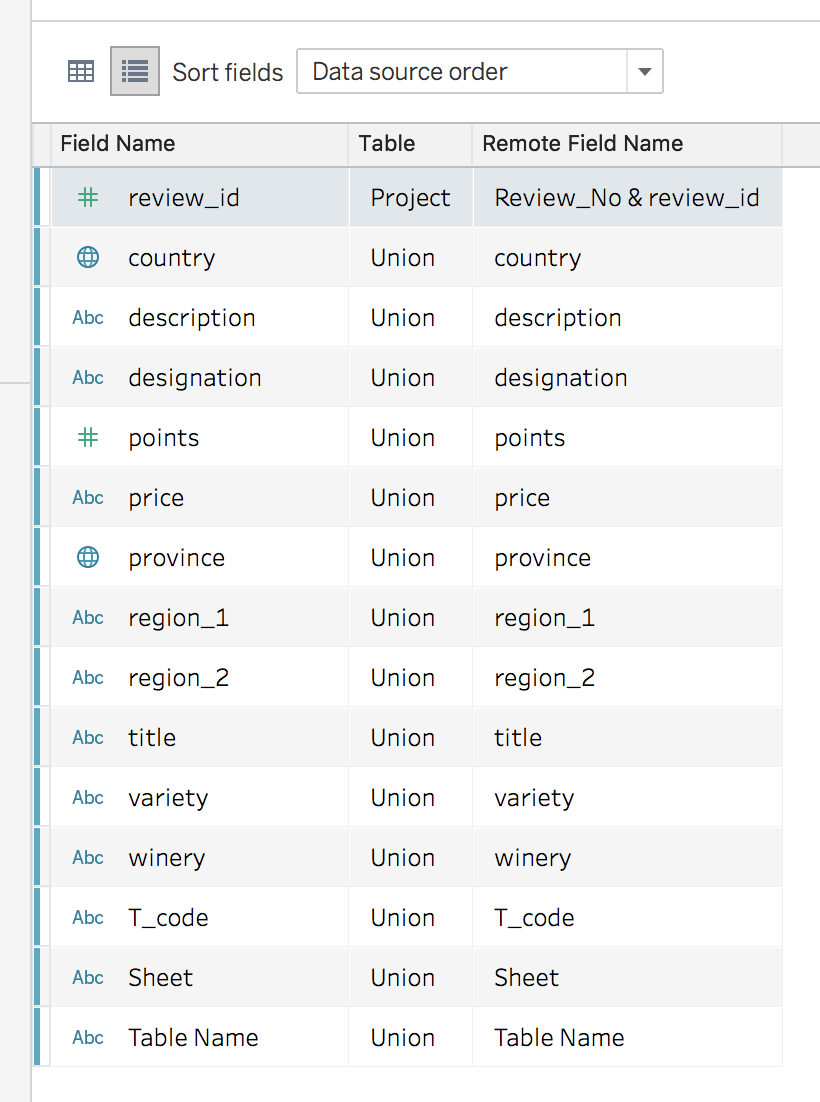
After completing these steps, you should only have one column for review_id, as shown below.
Combining Data in Tableau With JOINS
Here is a visual image of what a JOIN looks like:
Remember that you need a common field between your tables (such as a column of IDs--identifiers or keys) when you are using a JOIN to combine data. In the color diagram of a join shown above,, the yellow column would be the common field between the first two tables.
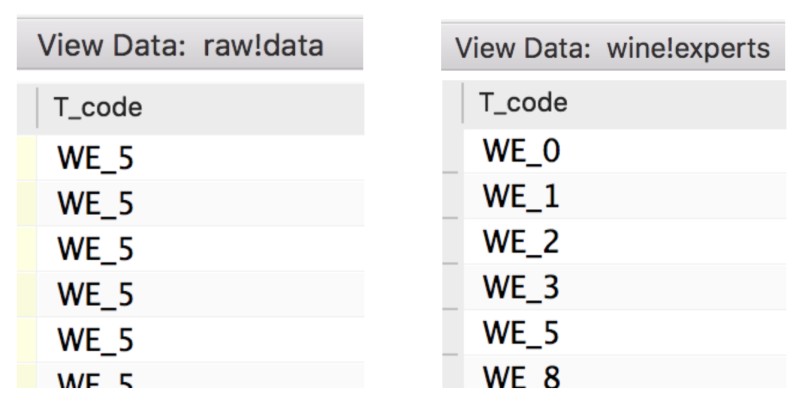
Using the View Data option in Section C, you can see that the T_code field exists in both the raw_data and wine_experts tables.
Go ahead and drag and drop the wine_experts table into the virtual workspace (Section D). You should see an INNER JOIN icon show up in Section D, as shown below.
Remember, there are four main types of JOINS when it comes to combining data tables. They are as follows:
Inner Join
Full Outer Join
Left Join
Right Join
If you need a refresher on the different types of joins, I recommend you check out this resource.
We want to change the inner join to a left join. Why? Because we want to keep all the data from our (left) Union table, and only bring in rows from the wine_experts table when there is a match in the T_code column.
To do this, click on the INNER JOIN icon, and you should see the following join properties window appear:
In this window, you can select the type of join that is best for your data. We need a LEFT JOIN, so go ahead and select Left Join. You can also change which columns Tableau should use for the matching fields between the data tables. We want the T_code field to be used (our "yellow join column"), so no change is necessary here.
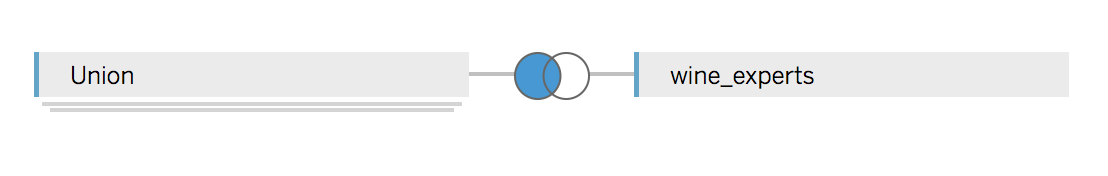
You should see a LEFT JOIN icon after the change, as shown below.
Section F: Save Your Work!
Let's take some time to save the work we've done so far, so we don't lose it! If you try using the Save button found in Section A of the Data Source page, you will not be able to save. Tableau needs you to create a sheet in the Tableau workbook file before you can save.
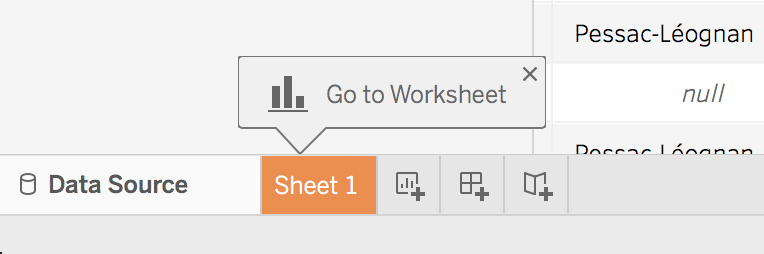
Go to Section F of the Data Source page, and click on Sheet 1.
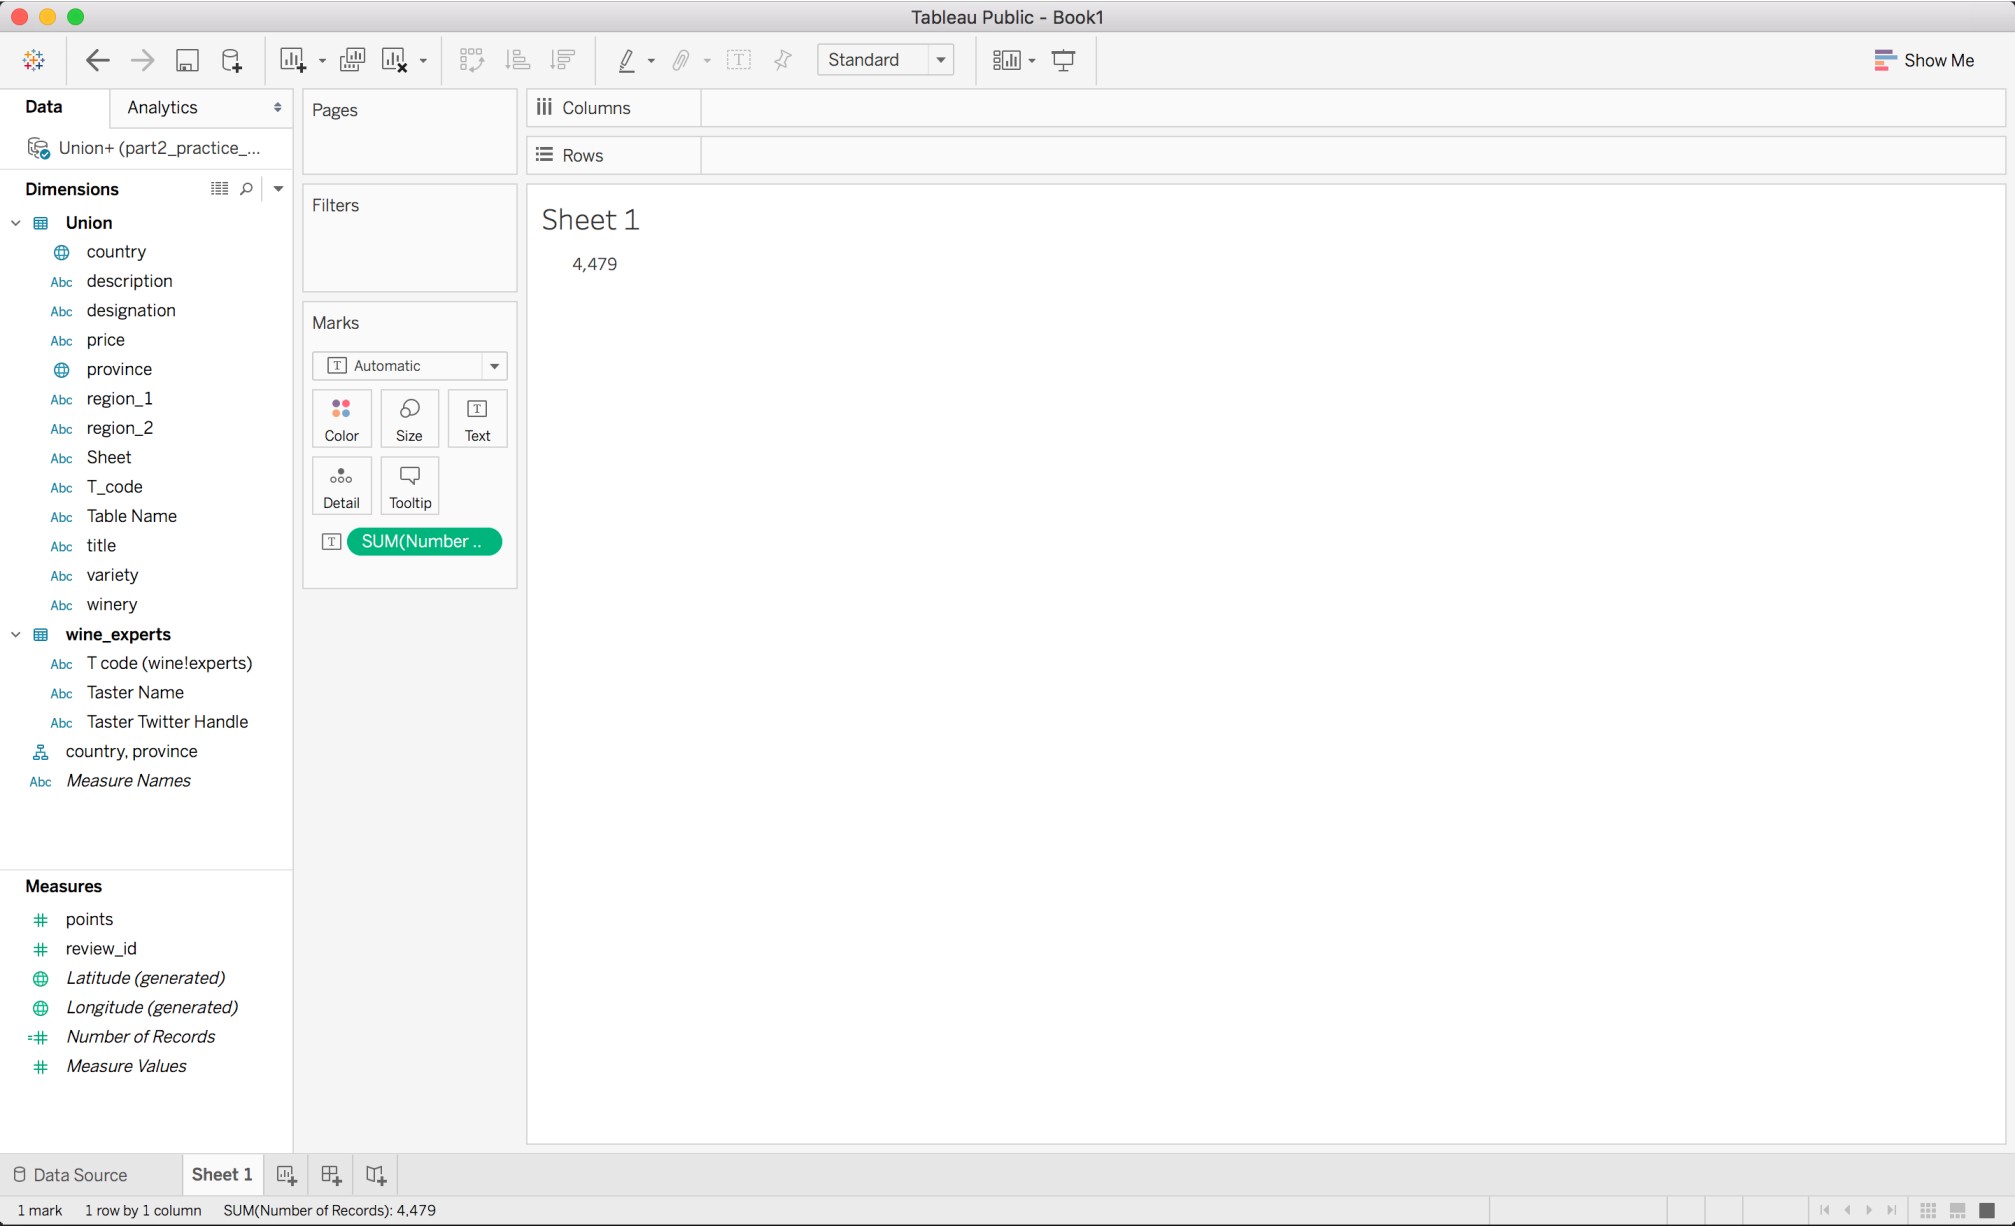
In the following chapters, you will have a proper introduction to Sheet workspace in Tableau. For now, focus on saving your work. Even though you have added a new sheet to your workbook, you haven't made any actual changes, so there is nothing to save. Go ahead and drag and drop the Number of Records field into the middle of the screen.
Your screen should look similar to the one below. Make sure you see the total number of records, 4,479.
Now you should be able to click the Save button in the top left area of the screen. I am going to name this workbook practice_workbook_1. Feel free to do the same or use a different file name. You may be prompted to sign-in to your Tableau Public account. You need to be signed-in in order to save your workbook.
Depending on the size of the Tableau workbook file, your internet connection, and your computer specs, the save time may vary. Please be sure to let Tableau do its thing and finish saving your work. You will get confirmation that your save was successful when Tableau launches a browser window or tab with the link to your work online.
Summary
Section D of the Data Source page is a visual workspace for combining your data with:
UNIONS: This is where you stack one dataset onto another dataset using the New Union button.
Warning: If two column names are different (even though their content is the same), then you need to merge them by using the Merge Mismatched Fields button.
JOINS: This is where you match one dataset to another by identifying a common field.
Tableau allows you to change the type of join to inner, left, right, or full outer depending on your needs.
Section E is a data preview area. In this section, you get a preview of the table that you are loading as your workbook’s data source. You can see the fields (or columns) and the first 1000 rows in the data table. You can also change the number of rows that you are viewing.
Section F is the place to save your work!
You need to create a sheet in the Tableau workbook file before you can save.
Remember to do so consistently!
In the next chapter, we will focus on completing data cleaning tasks in Section E, or the data preview area of the Data Source page!
