Map the Steps of Your Customer Journey Back to Your Sales Funnel
In this chapter, you will learn about using a sales funnel to classify the customer journey steps into stages from visitors to loyal customers.
Mapping the customer journey back to the funnel in this way means that you are aligning your CRM strategy with the organization’s view of the sales process. This can be vital in persuading the senior management team to allocate the resources, money, and time you will need to deliver your CRM strategy.
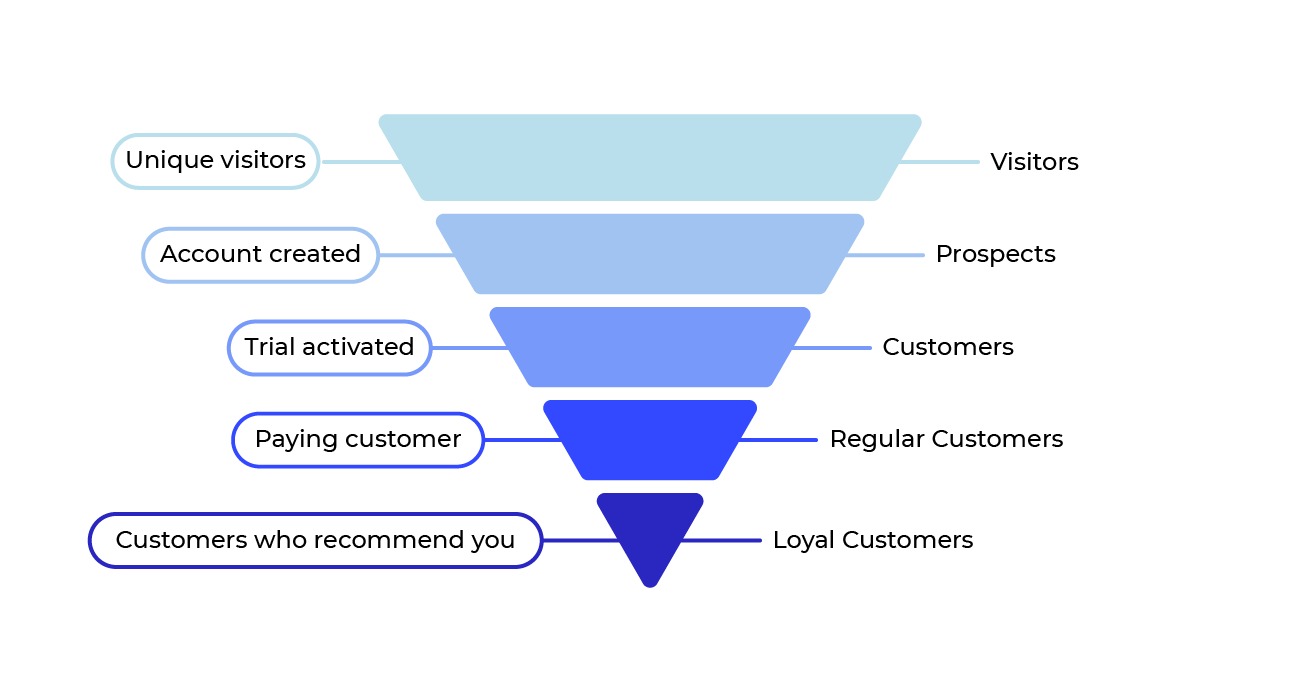
Recognize the Sale Funnel Stages
Visitors: The first stage of the funnel is typically a visit to your website (or a store or branch). You can count these visitors - and the pages they view on your website. Using cookies, you can go a step further and identify unique visitors.
Prospects: Visitors who move on to the second stage become prospects: people who have shown interest. Perhaps they stayed on the site for a while or added items to their cart.
Customers: At the third stage, you convert prospects to customers.
Regular customers: You’ll need to define the number of purchases it takes to become a regular customer. For some businesses, any second purchase is enough; for others, you might set the bar higher.
Customer loyalty: Which metrics measure customer loyalty in your business? It is often based on the contract renewal rate of additional services added to an existing contract or the customer’s willingness to recommend your service to friends and family.
For some businesses, such as subscription services, there may also be a middle step between stages 2 and 3, where you offer a free trial. You might call that step 2.5 if this fits your business.
Stages 1, 2, and 3 tie back to turnover. Stages 4 and 5 measure the organization’s success by focusing on those customers who contribute the most to the increased profit.
Define Funnel Metrics
The cut-off point for funnel stages can sometimes be hard to determine. When does a customer become regular or loyal?
You’ll need to define how your company will measure this. Here are some suggestions of the most widely used metrics for each stage.
Track Accurate Data at Each Stage
For all of these metrics, you must be able to zoom in to study the detail or zoom out to get a helicopter view of what’s happening. Therefore, each event should be marked with a:
Time stamp
Date stamp
Customer location
Customer’s unique ID
Each metric should be transparent in scope and type of data included, indicating who is responsible for each piece of data and what methodology has been used to collect them.
Apply the Pareto Principle to Uncover Loyal Customers
Looking at the frequency with which customers use your services, you could use the Pareto Principle to identify the most valuable 20% of users representing 80% of your profit.
Perform a RFM Segmentation
To further evaluate customers and be more precise in recognizing “star” ones, you can use a well-known segmentation method: RFM segmentation. RFM stands for recency, frequency, and monetary value. It helps the companies to score its clients over a period of time according to three metrics:
Recency: When was the last purchase?
Frequency: How many purchases over the period under review?
Monetary value: How much did the customer spend in total over the same period?
This method groups customers based on their RFM score.
To translate a “Last date of purchase,” “a Total value spent,” or “the number of orders” into an R or F or M score, you need a matrix table.
For example, the following table uses the quartile method. This one helps you give a score of 1 through 4. The final RFM segmentation will use these scores together.
| Quartile 1 | Quartile 2 | Quartile 3 | Quartile 4 |
Orders | 1 | 2 | 3 | 4 |
Total value | 1 | 2 | 3 | 4 |
Days from last purchase | 1 | 2 | 3 | 4 |
Performing RFM-based analysis allows you to understand customer behavior and predict how segments could evolve in the future.
Below is an example of how you must calculate the RFM score for each customer before ranking and grouping them (Source):
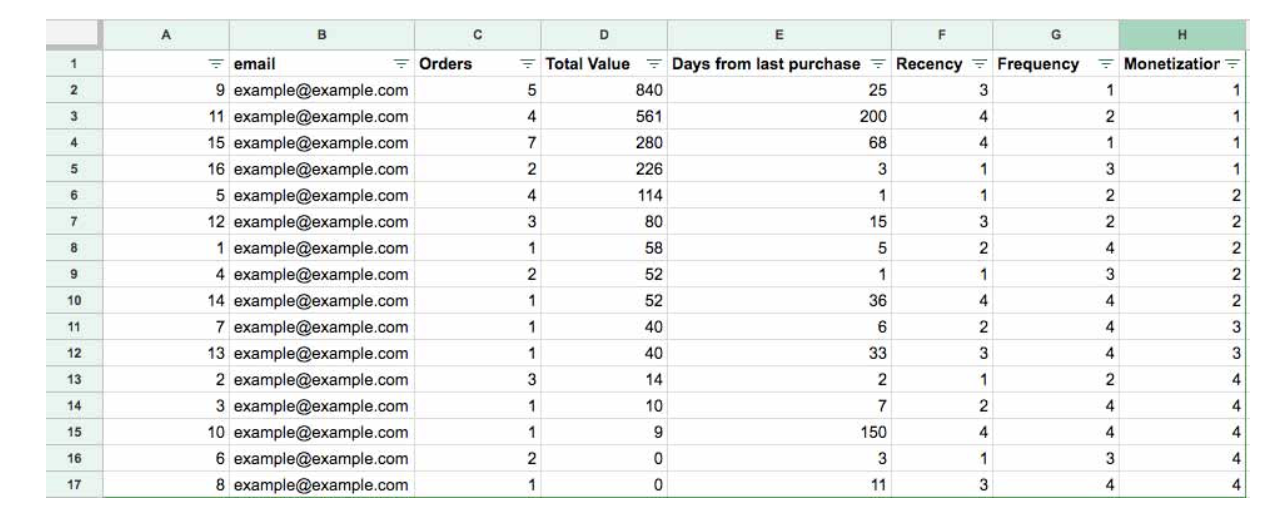
The last thing you have to do is calculate the total RFM score for each customer to identify: the highest paying, the most faithful, etc. And, of course, the best customers.
Let's Recap!
Customer journeys can be mapped to business value by tying the steps back to the five stages of a sales funnel.
Aligning your CRM strategy with the business value of customers throughout the sales funnel means you can convince the organization that the investment in CRM is worthwhile.
The Pareto Principle shows that 80% of your profitability lies in 20% of your most loyal customers.
Once you know the business value of your customers, you will need to collect and analyze data to better understand customer perception of your brand. We will show you how to visualize this data in the next chapter.
