Examine Details in Your Code by Setting Up Breakpoints
Hitting the Breaks Before an Exception
Have you ever watched a movie and suddenly thought you spotted an actor making a cameo? Movies are usually fast-paced going from scene to scene, so it's hard to be sure. When it happens, your brain thinks, "What just interrupted my suspension of disbelief?" What do you do when that happens? You probably rewind and watch it again. You might try to pause the frame and examine the detail. Sometimes you confirm what you saw, and sometimes you realize, "No, that's not Elvis!"
Your code is a little like this. Individual instructions are executed like the frames of a movie. As you zoom away from the code, you see different levels of abstraction. The further you zoom out, the individual instructions start forming parts of methods, classes, packages, and ultimately the entire application. If a bug makes a cameo, it will be harder to single out the tree from the forest.
When you're looking for a bug, you want to see the intricacies between each statement of your code to better understand what is failing. You want to focus on the individual trees!
Hold on! Our code runs so fast, how could we possibly follow what it's doing?
This is true. Applications race through from instruction to instruction. To follow what's going on, it helps to focus in on a particular piece of software, like watching for an Elvis cameo. You want to hit the brakes and pause when JVM sees an interesting line of code. You could then watch it play out step by step!
Luckily, debuggers allow you to stop code anywhere. You're going to see how to use the debugger to run your app right up to the point just before it crashes. This way, you can inspect the evidence leading up to your thrown exception and start to formulate a theory about its cause.
When we ran the failing test, you saw a stack trace that started with:
com.openclassrooms.debugging.exception.InvalidSaddleSizeException: Unexpected saddle size:-49.0
at com.openclassrooms.debugging.DragonSaddleSizeVerifier.verify(DragonSaddleSizeVerifier.java:13)
The error shows that the code throws a custom Java exception of the typecom.openclassrooms.debugging.exception.InvalidSaddleSizeException from the verify() method of the com.openclassrooms.debugging.DragonSaddleSizeVerifier class. The stack trace also gives the line number in the source file. Let's have a look at Line 13:
package com.openclassrooms.debugging;

import com.openclassrooms.debugging.exception.InvalidSaddleSizeException;

public class DragonSaddleSizeVerifier {

   public void verify(Double saddleSize) {
      if (null == saddleSize) {
         throw new InvalidSaddleSizeException("Unexpected saddle size of null");
      }

      if (saddleSize <= 0) {
         throw new InvalidSaddleSizeException("Unexpected saddle size:" + saddleSize);
      }
   }
}
Line 13 takes the value of saddleSize passed in at Line 7, and throws an exception using throw new InvalidSaddleSizeException("Unexpected saddle size:" + saddleSize);.
Let’s set a breakpoint at that line and run the test again! A breakpoint is like a pause in the program that allows you to inspect what’s going on, step by step. To set one up, find the line of in codebase where you want to stop and click on the margin beside it. It should go red. This will tell the debugger to run the program and pause at that line.

Let's walk through how to do this:
Now you can run the test in your debugger so it pauses before the breakpoint. Let's do this together:
As you saw, the debugger showed a highlighted line of code at the top of the editor. It also displays a debugging panel in the lower portion of the screen. Let's have a closer look:
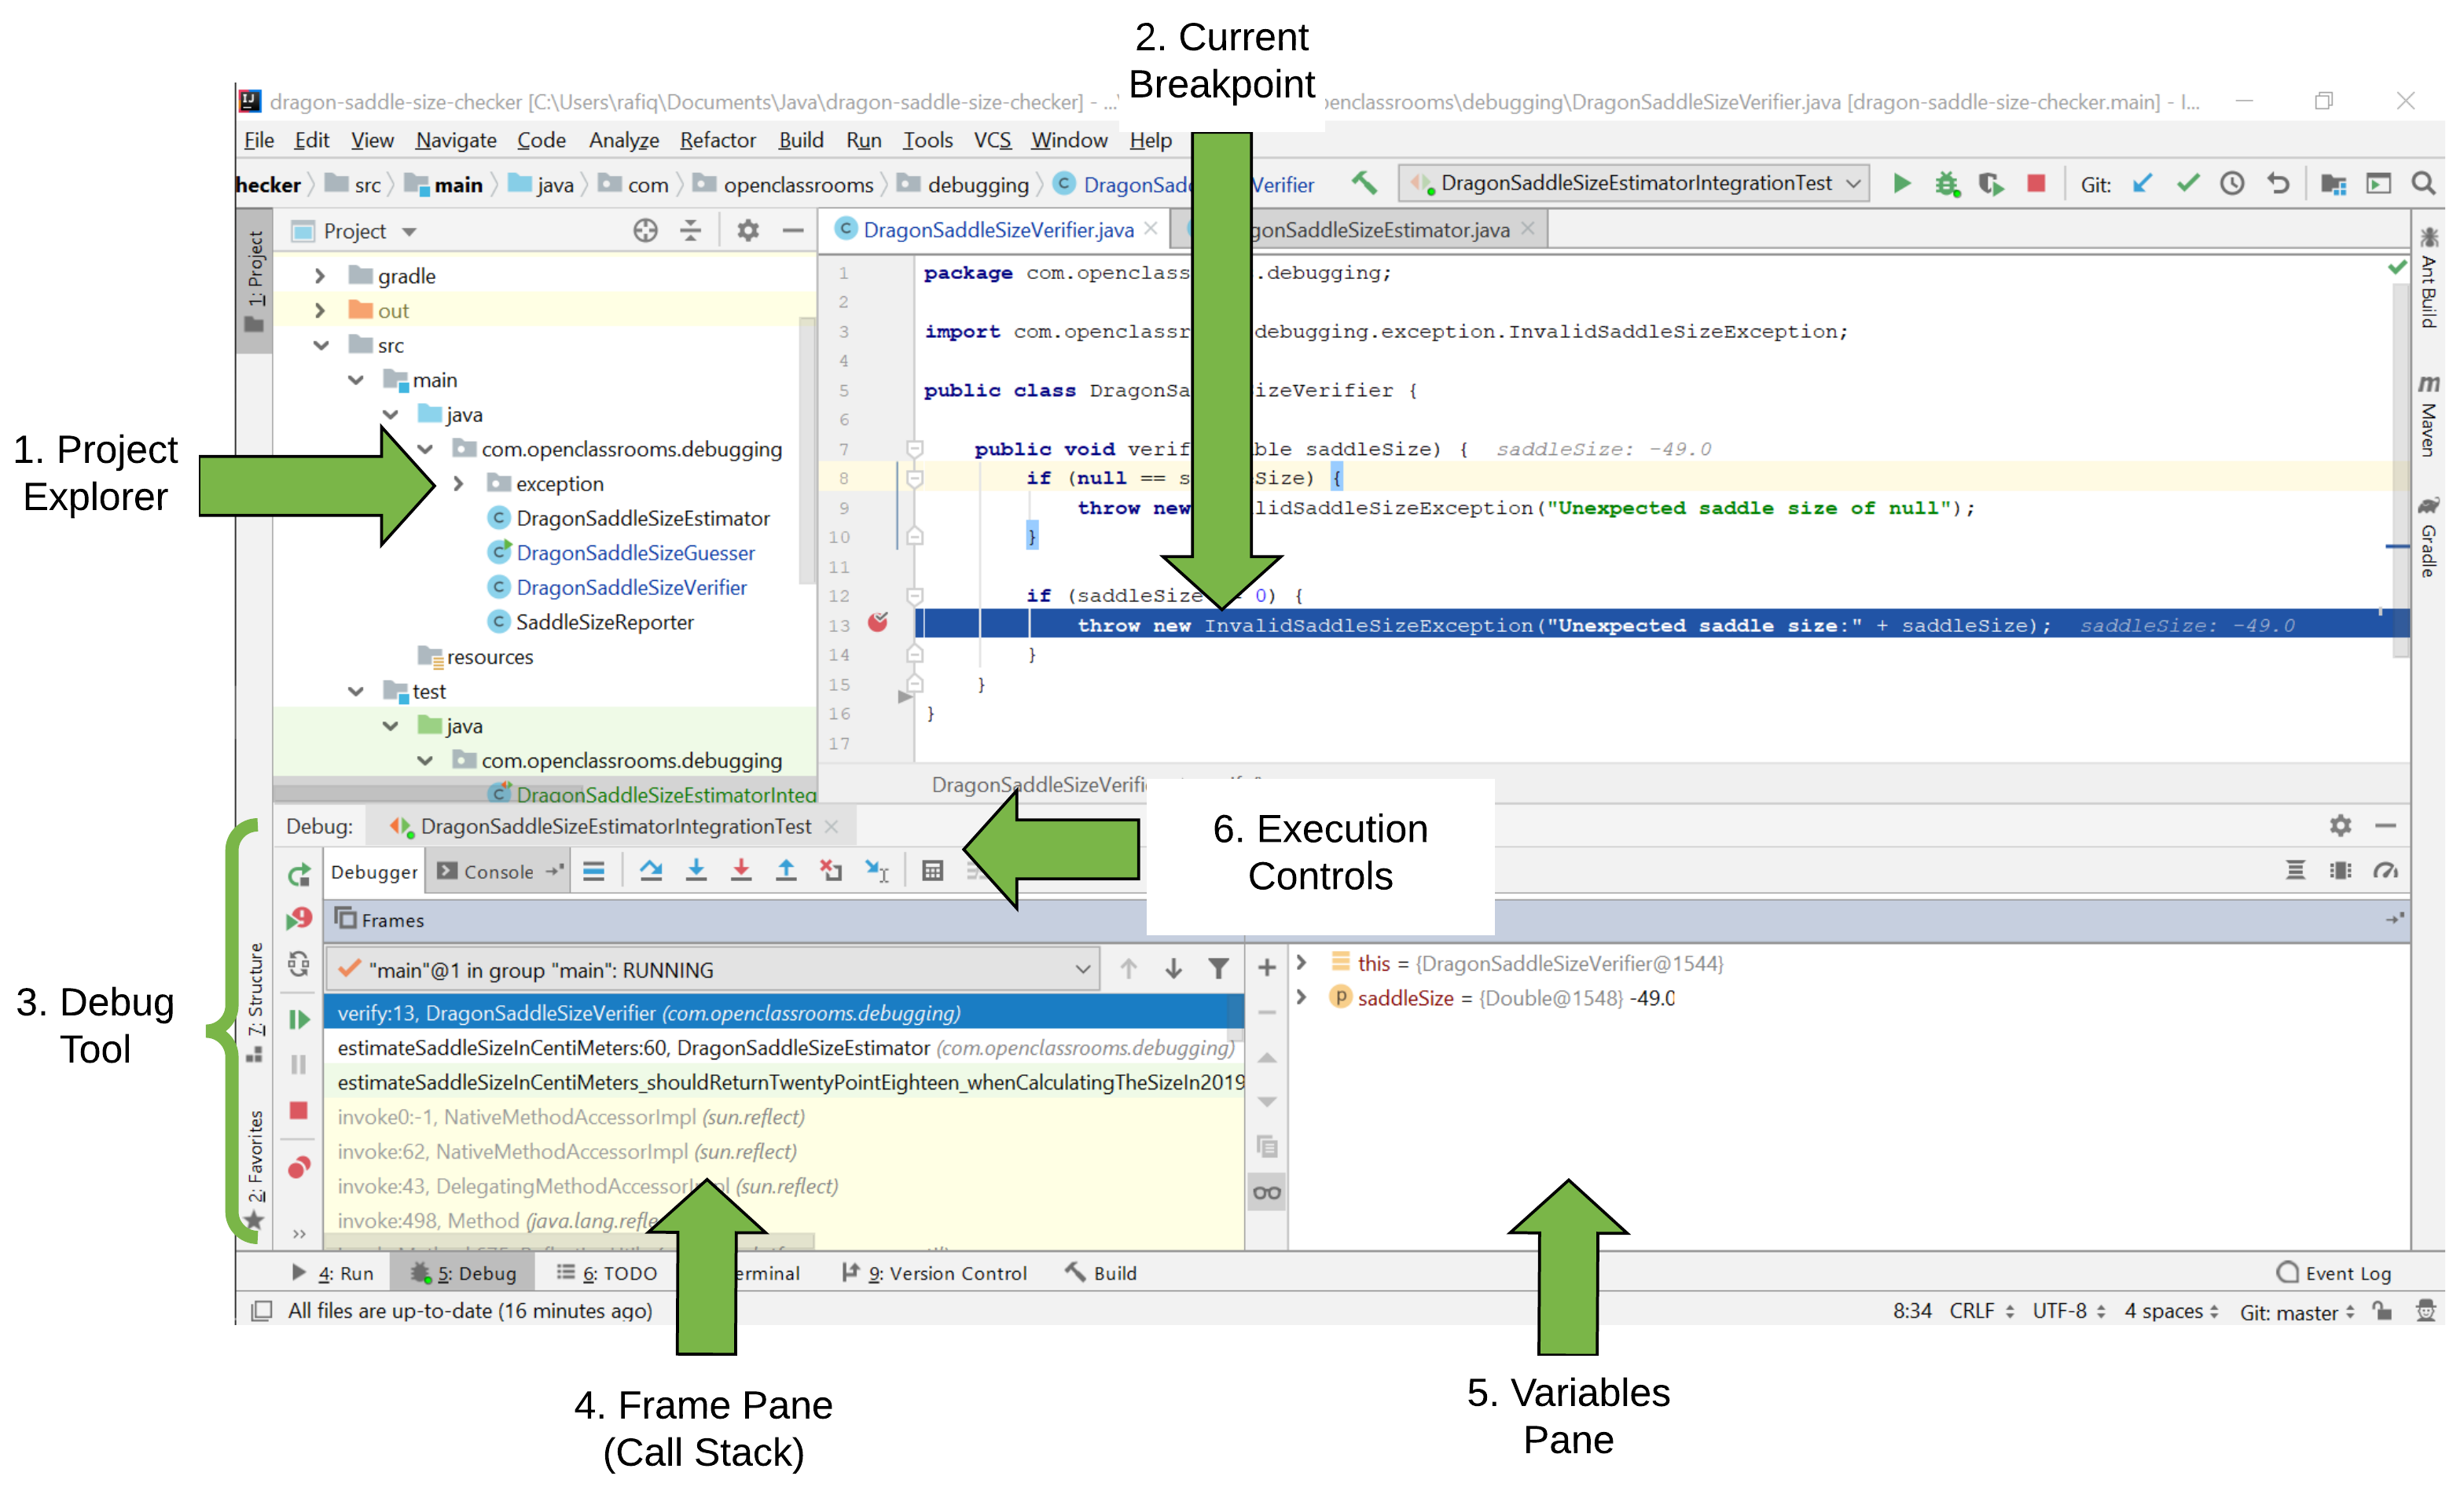
The project explorer window shows the project files such as the Java code.
The current breakpoint is highlighted in the editor pane, showing you the line of code on which the JVM has been paused.
The Debug Tool appears at the bottom of your IDE when you start debugging an application. This contains components to assist you in debugging.
The Frame Pane displays the call stack of your application, that is the series of method calls, and line numbers, which led up to the current breakpoint.
The Variables Pane displays all the currently scoped variables visible to the code at the current breakpoint.
The Execution Control buttons can be used to control the flow of your application. These are the remote control buttons and determine whether you continue inspecting your code in slow motion or fast forward to another point.
On the left side of the Debug Panel, IntelliJ also provides several other handy tools to stop and start the debugger. You can end the debugging session by hitting the red square stop button.
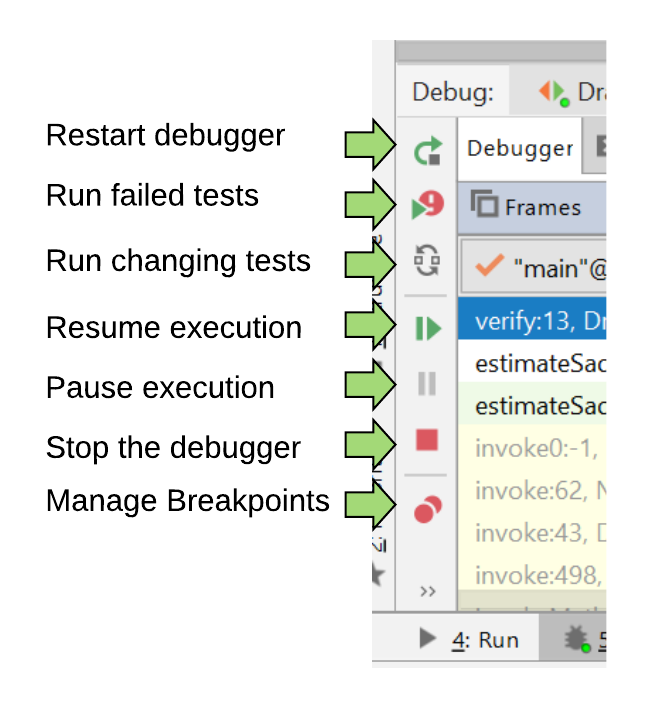
Using these controls, you can:
Restart the current debugging session.
Rerun all your most recent failed tests.
Make your tests auto-run when they are modified.
Resume execution and unsuspend the current breakpoint.
Pause an unsuspended JVM at its current point of execution.
Stop the current debugging process altogether.
Enable and disable various breakpoints throughout your application.
These can be useful when running your tests in the debugger. You'll see how to use some of these later.
Adding Additional Breakpoints
Have you ever explored a town you didn’t know well by remembering places relative to landmarks like a cinema, restaurant, or cafe? “Right, that’s the ice cream shop behind the cinema.”
When you run your failing test, it forms a route, just like a journey through a town, but instead of traveling from waypoint to waypoint, you move from statement to statement, going down into other methods that get called.
In our example bug report, the user was checking the saddle size of a dragon in 2019. As you've seen in our stack traces, this involves a journey through several methods:
Either the
main()method or integration test is usually our first code to run.Both
main()and our test then callDragonSaddleSizeEstimator.estimateSaddleSizeInCentiMeters(2019).This calls
com.openclassrooms.debugging.DragonSaddleSizeVerifier.verify(...).
As you are now a detective trying to figure out the cause of a bug, wouldn’t it be great if you could also stop code in a few places to examine the mystery unfolding? You could first stop it in your test, and then in the estimateSaddleSizeInCentiMeters method and finally, the verify method. In other words, you set multiple breakpoints.
It's the same process as before, except you do it in more than one place. For example, you can click on the margin beside multiple lines in multiple files.
Let's assume that the year we passed to our program is getting changed without our knowledge. The year is passed between a few methods and it might make sense to check that it’s exactly as we expected at each hop:
This allows you to debug your code again and immediately stop at the first breakpoint visited by the JVM. Once in there, you can inspect whether you’re correctly passing your values around the code. By hitting resume in the execution control panel, you can allow your application to keep running until the next breakpoint. Once again, your code suspends. You can keep hitting resume until the program ends; in this case, by crashing out!
Now, let's check out how to move between multiple breakpoints.
By moving between breakpoints, you can inspect how values are passed between methods. So now, let's check out the evidence so far:
What have you learned in this phase of the investigation?
In this case, it seems clear that the year does not change at all.
targetYearwas still set to 2019 at the point whereestimateSaddleSizeInCentiMeters()calledverifier.verify(double saddleSize).Further, the
verifier.verify(double saddleSize)method is passed a value of -49 by the estimateSaddleSizeInCentiMeters(int targetYear) method, implying that we calculated a negative saddle size long before the exception was thrown.
That was some good investigating! Our theory that the date was being modified is false. However, we now have the tools needed to stop in multiple places as we investigate the issue. Stepping through the code enabled you to see which values the variables contained at different points in the program's life.
Managing Breakpoints
As you add more breakpoints to your code, it can become tricky to remember where they are set. It's especially important to remember when you need to remove the ones that are no longer useful.
You can use IntelliJ to manage all your breakpoints from one place, called the Breakpoints View.
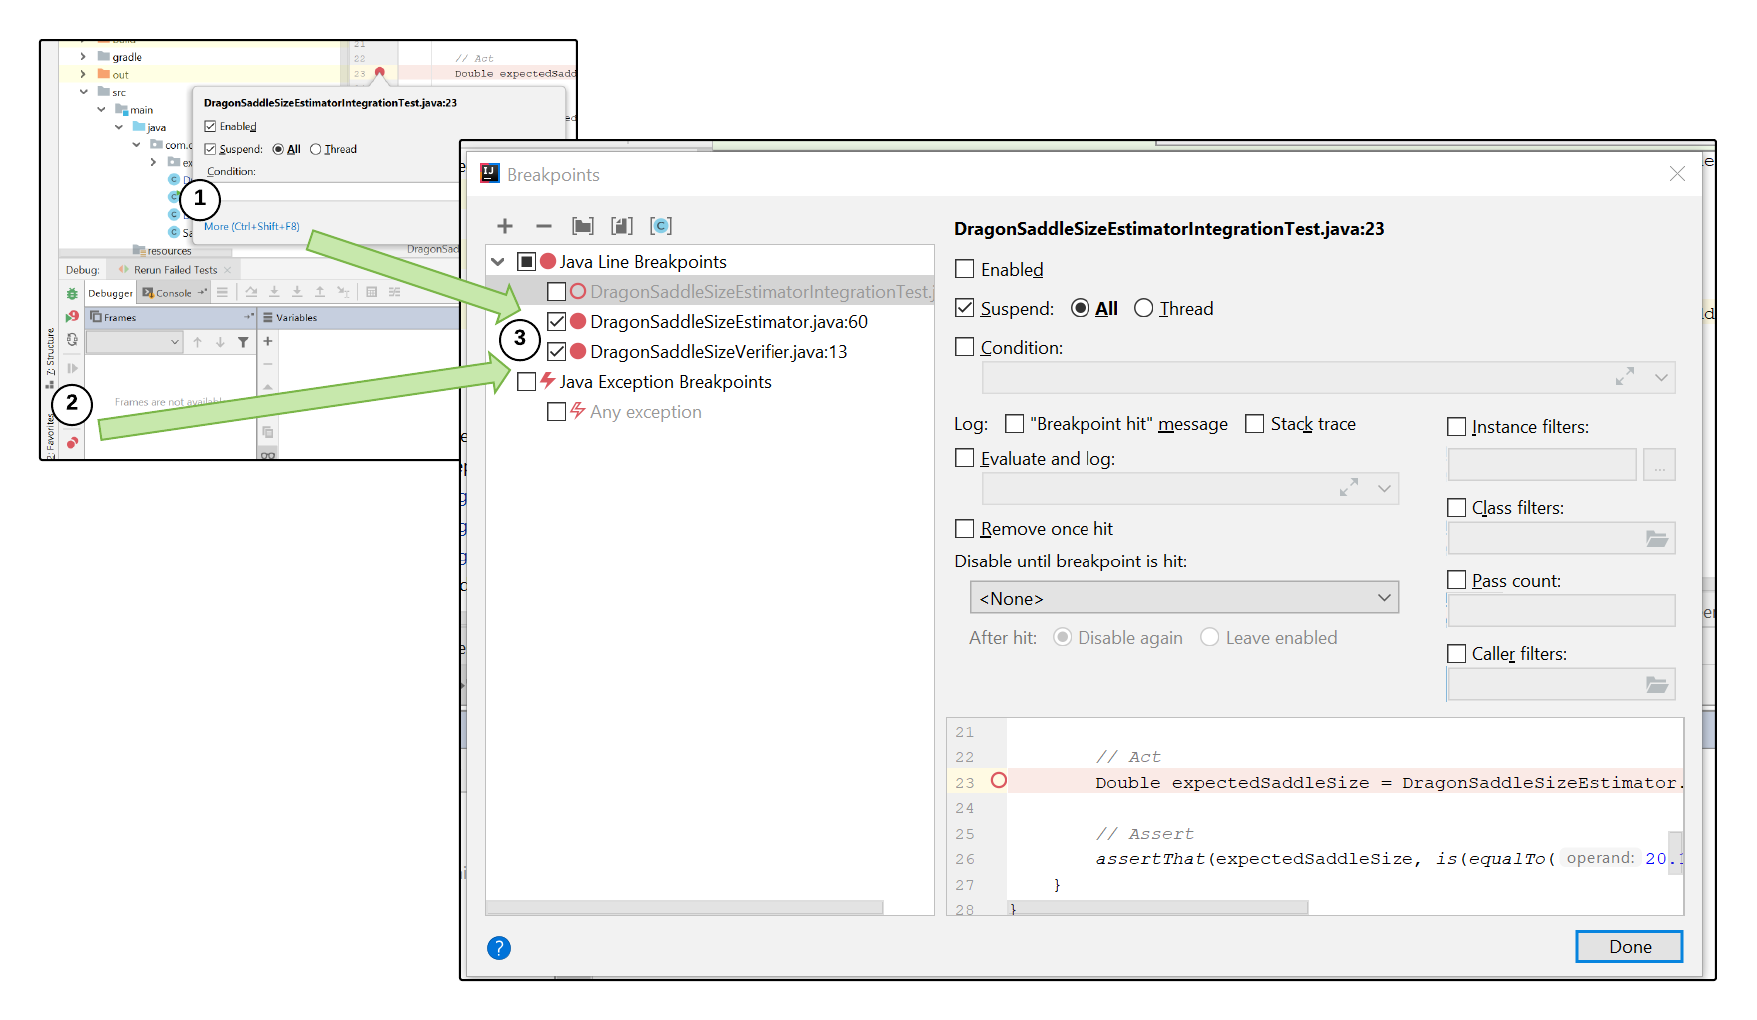
Right-click on the redbreakpoint, and click more.
OR hit the double red dot to view breakpoints from the debug tool.
You can now check and uncheck breakpoints.
As you can see, I've unchecked the integration test, preventing the debugger from stopping in it. I did this because the bug appears to be between the test and the verifier.
Let's Recap!
A breakpoint represents a line of code that you've told the JVM to run up to and then suspend for you to investigate.
The debugger can show you the variables currently visible to, and in, the scope of a breakpoint where you're suspended.
To check how values are being modified between method calls, place multiple breakpoints through your source code.
The debugger allows you to resume from any breakpoint and will suspend at the next one it encounters.
An exception's stack trace can show you the chain of method calls leading to your failure. Use this to help decide on where to break.
In the next chapter, we'll check out another type of breakpoint - conditional breakpoints!
