Profile a Program With VisualVM
Understanding Performance Degradation
Imagine that a user raised a bug report stating that the Dragon Saddle Size guesser was taking too long to estimate the correct saddle size. Dragon tamers are busy people, and such a delay is unacceptable to the ruling monarch of the Eight Kingdoms. 🐉 Even if that monarch's wrath doesn't phase you, it's important to ask, "Why would our software suddenly start slowing down?"
There are many factors that might affect journey times. Have you ever traveled by public transportation and had several routes from which to choose? Taking the wrong one might set you back an hour! Route-finding apps are good at giving options as to how long different ways would take.
Now think of your code running on the JVM with all the different branches or methods it could take depending on the data and arguments you give it. Your software is also vulnerable to performance degradation every time you add a new method or branch which the code might have to visit. Why is this? When your code runs, the JVM is generally taking a journey from class to class, method to method, and is trying to reach its goal. Internally it does its best to make running your code as fast as possible, a little like those route-finding apps.
The issues with Java performance are usually caused by developers. We often design software that even the JVM can't speed up since algorithms either solve a problem in the slowest way possible or they have some other mistake.
When you have a performance issue in your code, try to work through it by:
Measuring your code to find what action is slowing it down and where in the code this happens.
Investigating the non-performant code and question what it is trying to achieve and why.
If the code can be immediately removed or simplified, then do so.
Measure your code again to see if you've improved it!
Are you saying that I might slow down my application? How is that possible?
There are many things you can do to slow your software down without realizing it. The most common causes involve writing inefficient algorithms and code that block other code from running as soon as it could.
Let's look at a few causes in turn!
Performance Degradation Cause #1: Inefficient Algorithms
Remember, an algorithm is a series of steps that allow you to define how you'd take input data and arrive at the desired result.
When you write methods and functions, you generally chain a series of statements together in your programming language. These statements solve some problems by inspecting your data and applying rules you think will help solve the specific part of your problem. In deciding how to implement those rules as a code, you define an algorithm or a series of steps your code will have to perform.
Depending on the algorithm, you'll implement different code that will impact how quickly it handles different inputs. For instance, if you had a line of giraffes in height order, how would you determine the tallest? You could start with the first in line and measure each one. This might be fast for two but would get slower with a larger herd. Measuring thirty would take considerably longer and probably agitate the giraffes. Since they are already ordered, it would be more efficient to go to the end of the line. This algorithm never gets any slower!
Taking the time to consider how your code scales to efficiently handle different inputs can keep it performant. It's not always obvious or easy, particularly if you think that you'll only ever see two giraffes!
Performance Degradation Cause #2: Blocking Code
Most of what you write as a developer is serial code. That is, you write algorithms that take one step at a time in order. For a step to start, the previous must have finished. Any statement which other statements are waiting for is known as a blocking statement.
Software is so fast that this is usually fine. However, consider what might happen if your blocking statement involves a slow operation, such as opening a file or performing an inefficient algorithm that takes seconds. Well, the next statement would have to wait for it to complete.
Hold on, doesn't each step depend on the previous one? How would you avoid this?
In many cases, a statement is dependent on a previous one, but not always. For instance, consider Pythagoras's equation for calculating the area of a triangle, a²+b² = c². Do you need to wait to calculate the square of side a before calculating the square of side b? If calculating a² and b² were slow operations, you could even do them at the same time; we call this a concurrent (or parallelized) solution.
Now, how would you know if one method was so badly written that it slowed down your whole application? Although you can’t use a route-finding app to work around the less performant portions of your code, you can watch how it is running to find which algorithms are slowing you down - kind of like looking at different traffic indicators that show congestion on specific routes. You use a code profiling tool.
What is profiling?
Profiling is like holding a stopwatch in front of your methods and measuring how long they take to return a result. ⏱️ It enables you to find slow methods in your code by measuring and comparing your calls to find the less performant ones. It can also capture other useful metrics about your app. This enables you to find issues impacting how fast your app behaves and how effectively it uses its available memory. Let's see how to do this in the next section!
Use VisualVM to Profile Your Code
To profile your application, you can use VisualVM, which is a Java profiling tool developed by Oracle (the makers of Java), and shipped with their JDK. Among other things, it allows you to measure the methods of your Java apps and how long they are taking to run. You can use VisualVM to connect to any running Java application.
Download VisualVM
You can either download the latest version of VisualVM from this link, or you can use the one that comes with the JDK. Try starting jvisualvm if it’s already installed.
Find your Java distribution information.
You can usually find jvisualvm by displaying your JAVA_HOME environment variable and looking under the bin folder stored there. This differs from distro to distro. Try to look under the following locations:On a Mac running OS-X, you'll find your Java distribution under
/Library/Java/JavaVirtualMachines.On Windows, you'll typically find your Java installs under
c:\Program Files\Java.On Debian Linux distros, you will find your dpkg installed
JDK under /usr/lib/jvm.
Locate the file.
Go into the JDK directory and navigate to the bin directory.
Under this, you will find a file called jvisualvm. For instance, on a windows installation, this will look like:
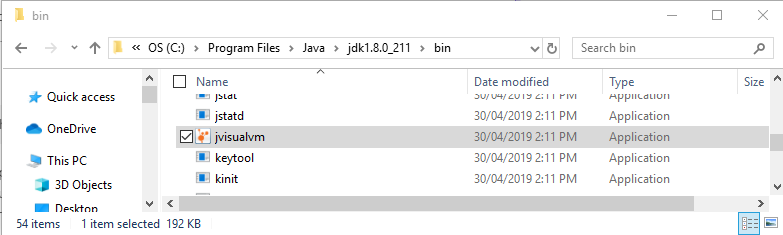
Start the file by double-clicking on it.
Ta-da! 🎉 Now you're ready to start profiling.
Profile a Program With VisualVM
Let's start by checking some buggy code. To look at the version of the Dragon’s Waist Size Guesser Project with a performance bug, you can use the same repository you cloned in Part 2. This time check out the branch performance-bug.
You can use IntelliJ’s VCM menu to check this out or use the Git CLI command:
git checkout performance-bug
Let's check it out in IntelliJ and run it:
Ok, let's recap our work:
We used the VCS (version control system) menu item and navigated down to git.
Next, we went to branches and checked out the performance-bug branch.
To test it, we ran the DragonSaddleSizeGuesser program, as we have done before. This time, it took close to 10 seconds to run.
To investigate why the DragonSaddleSizeGuesser app is slow, you need to start VisualVM. The Applications panel on the left displays running Java applications that you can immediately start profiling.
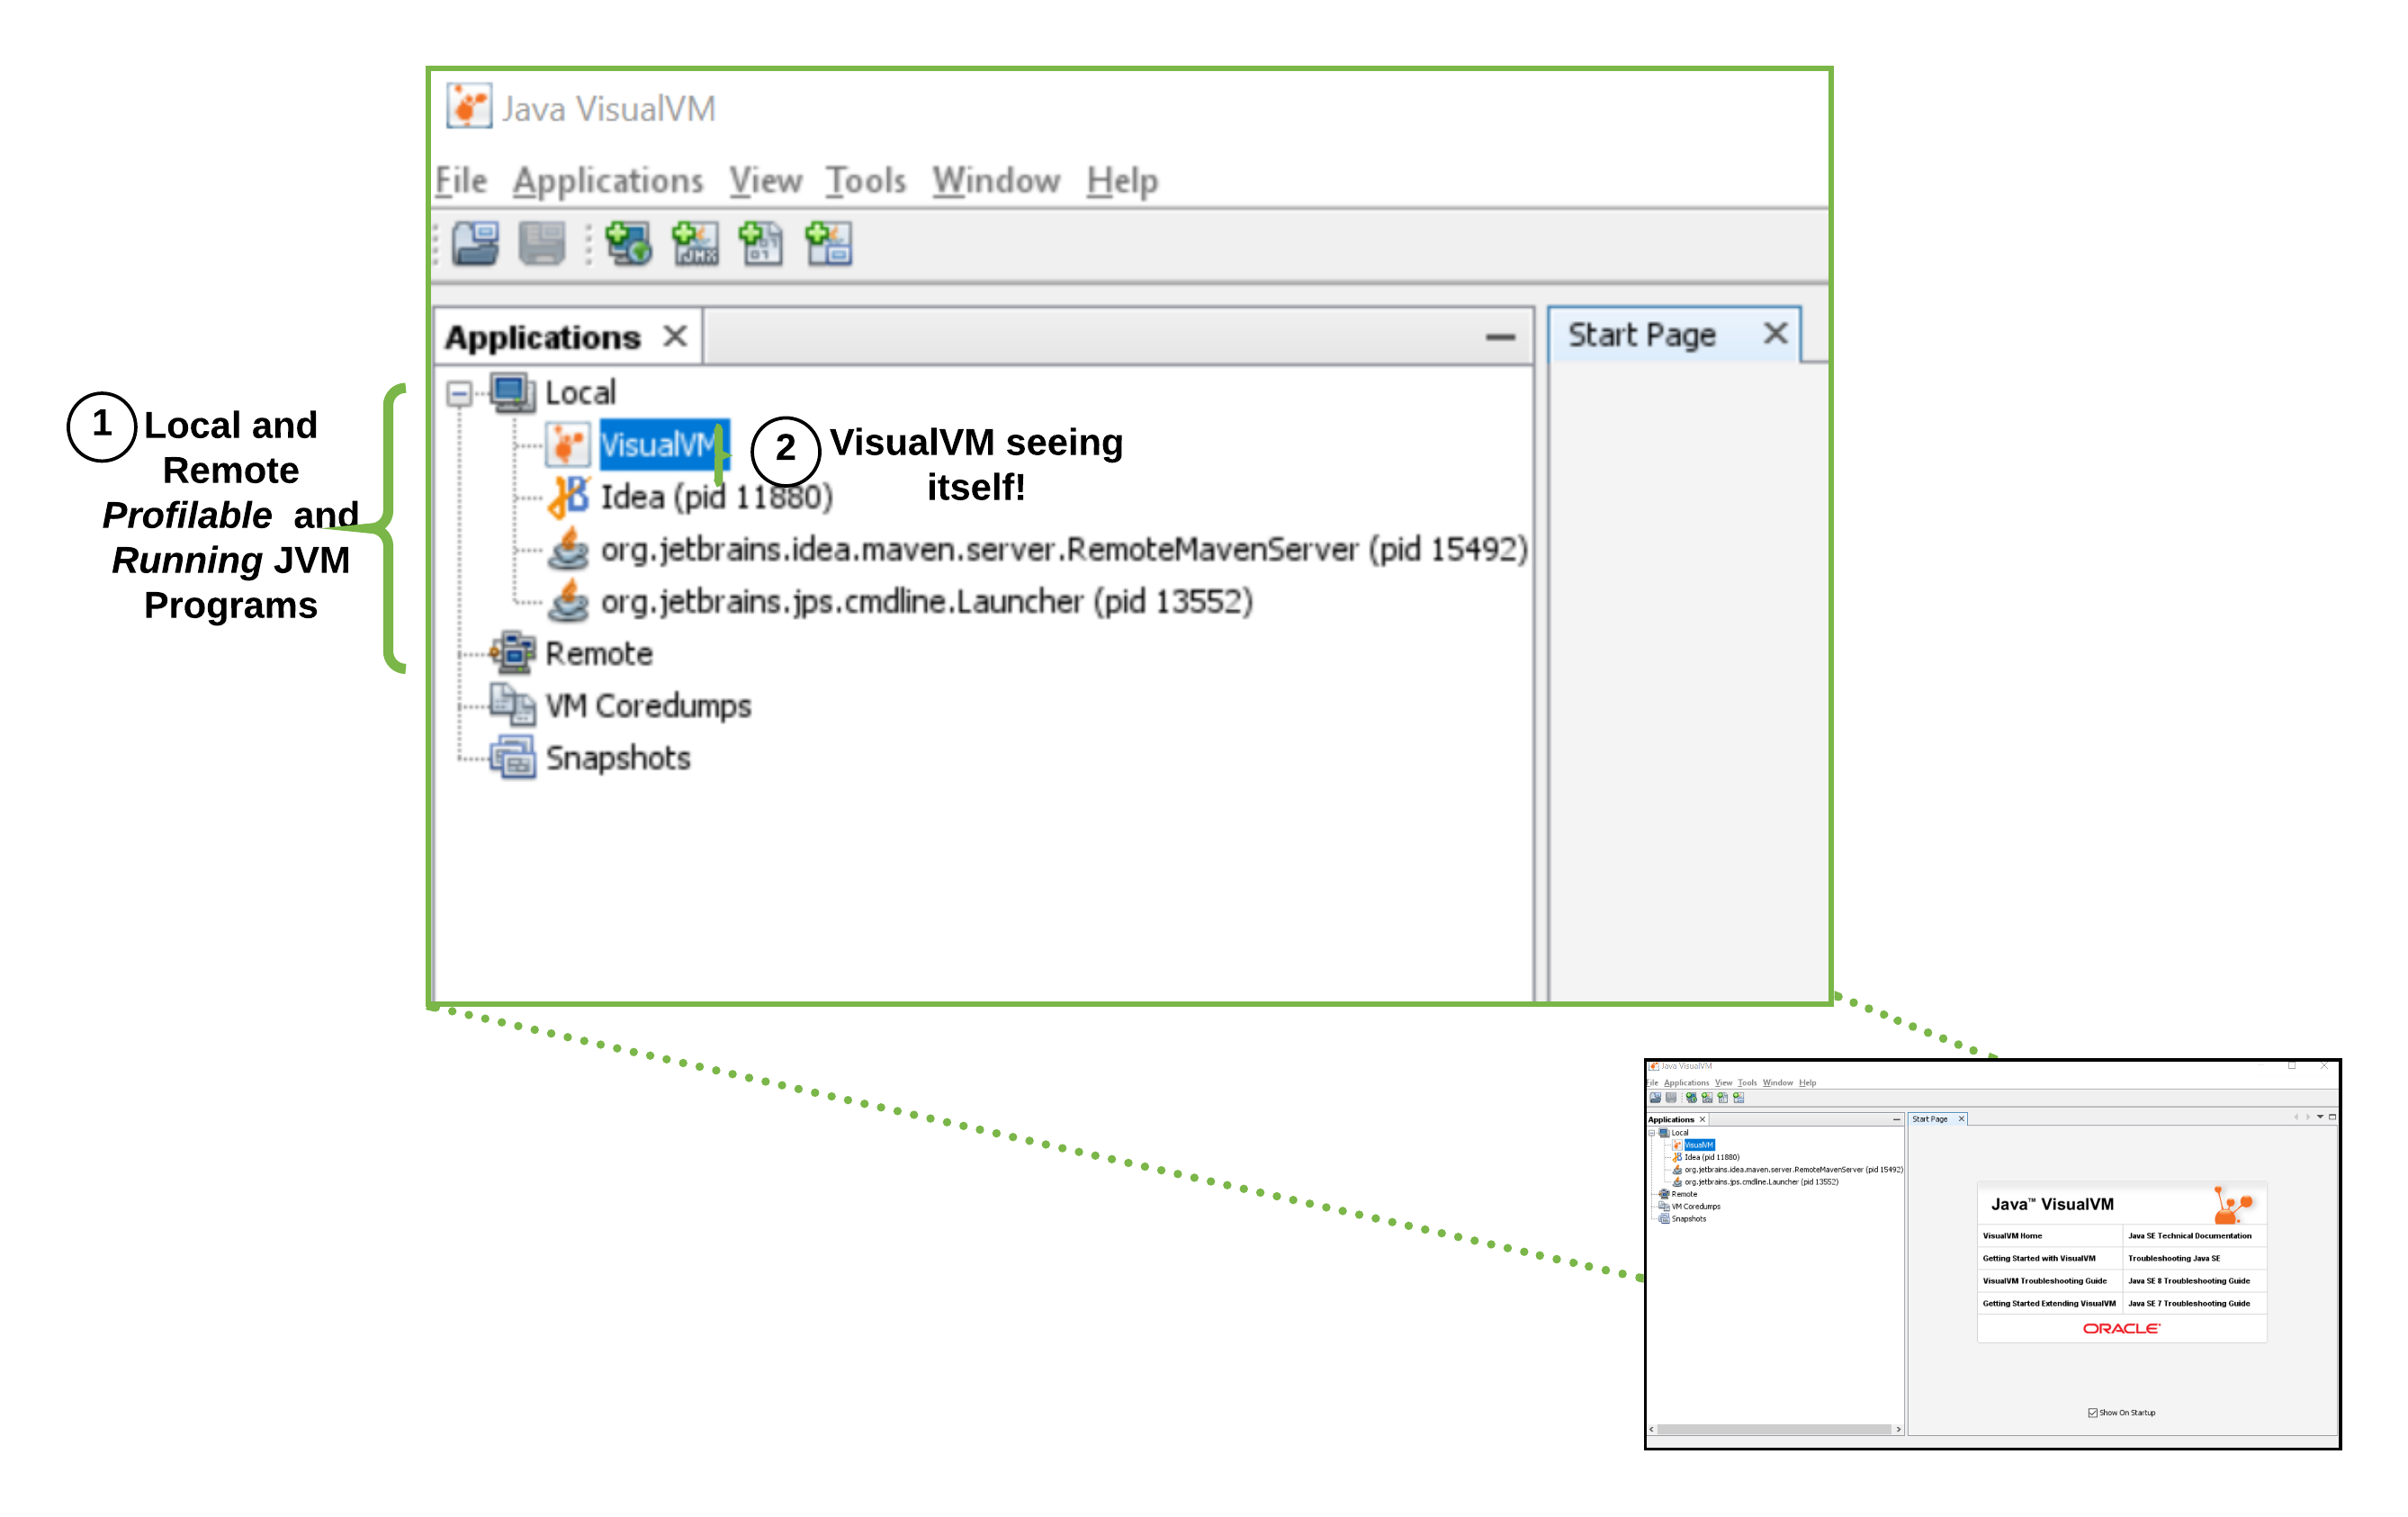
Click on this to see any running Java applications on your computer. By clicking on the VisualVM process, you can explore the provided panels. We will be searching for slow code, but I'll give you a quick overview first.
Let's do this together. VisualVM has a lot of features, and we're only going to focus on monitoring the time our methods take. To give you a quick overview, I'll use VisualVM to connect to itself, as it is just another Java process, and give you a two-minute tour.
Did you see how clicking on CPU under the monitor view showed the total time spent in each method? We're going to use this to find our slow one.
Here's a challenge: Can you start your DragonSaddleSizeGuesser and connect to it with VisualVM? Don't spend more than five minutes on it.
Have you given up yet? I bet you're wondering why the DragonSaddleSizeGuesser keeps disappearing. The problem with our program is that even with this performance bug, it is still a quick app that calculates a saddle size and stops running, usually under 15 seconds. This may be too slow for us, but it does make it tricky to find and connect to in VisualVM.
Fortunately for you, there is a plugin in VisualVM which allows you to profile an app from the moment it starts up. Let me show you how to install it:
As you saw, we went through the following process:
First, click on Tools and select the Plugins option.
Now scroll down and select Startup Time Profiler plugin.
Scroll down and accept the terms and conditions.
Hit install!
This has now added an extra icon in VisualVM with a little stopwatch.
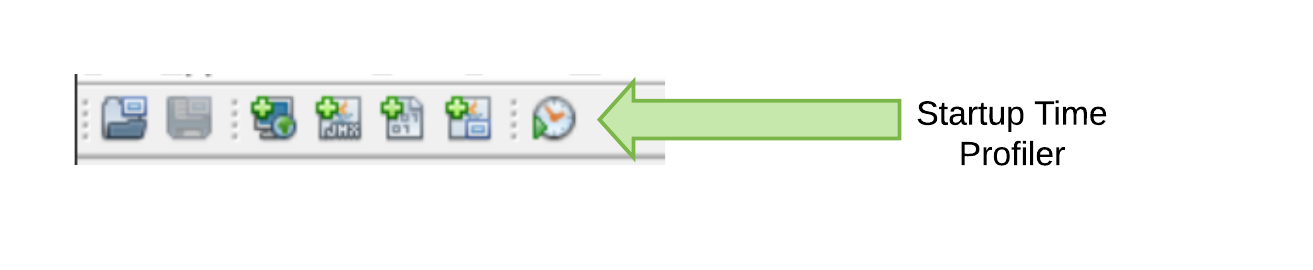
How do I use this to find the method that is slowing down my application?
To find the method that slowed down our DragonSaddleSizeGuesser, we need to run it using VisualVM. Unlike the previous example, we're going to setup VisualVM to wait for our program so it can start profiling from the moment it starts.
Let's do this together:
We now know which method is our culprit, but how did we find out? Let's break down what happened there.
We clicked on the stopwatch icon of our startup profiler and selected the correct JVM for our application. We're using JDK 8 as it's the version used by DragonSaddleSizeGuesser.
We selected a port of 5130, which helps our JVM send data to VisualVM.
Under Start profiling from classes, we entered the package name
com.openclassrooms.debugging.**. The double "*" makes VisualVM profile all methods of classes and subclasses under that package.VisualVM then gave us a few commands to copy using the Copy to Clipboard button.
We then opened IntelliJ and went to its Edit Configuration option.
We cloned the config we use to run DragonSaddleSizeGuesser and called it DragonSaddleSizeGuesser Profiler.
Under VM Options, we pasted the arguments we copied at Line 4. These are arguments passed to the Java command which runs our JVM.
After that, we entered a space and the argument -noverify.
With all of this in place, we ran the DragonSaddleSizeGuesser Profiler.
VisualVM warned us that the application had already finished and asked if we wanted to see a snapshot. By selecting yes, we were able to take our time to investigate the issue.
We've learned that the method we're looking for is: com.openclassrooms.debugging.DragonSaddleSizeEstimator.enterAProgrammaticTrance().
How do we know that's the cause?
In VisualVM, we clicked on Hot Spots, and it showed us a view containing the following:
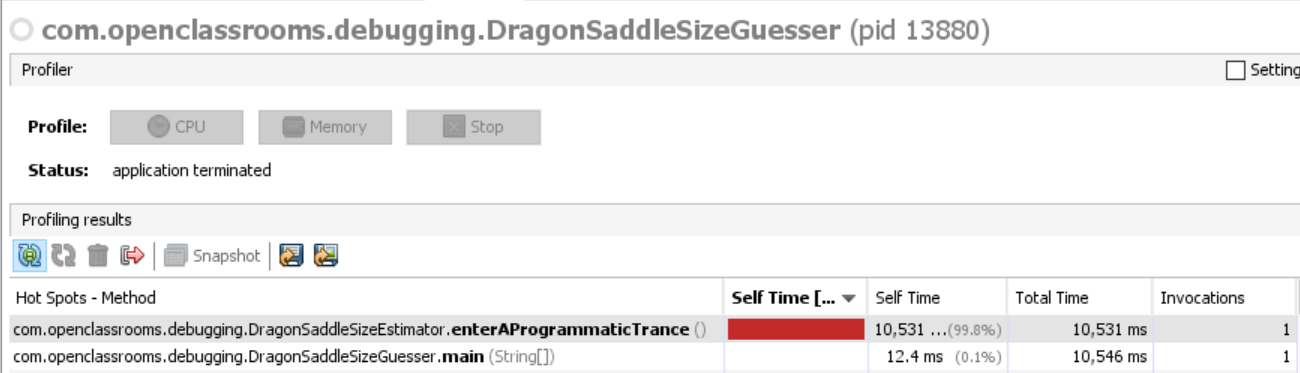
The Hot Spot view shows an ordered list of methods sorted by how much time was spent in the method. Like a weather presenter telling you it's 40 ℃ in Tenerife ☀, if you look at the top row of the table above, and look under Self Time, you can see that we have a performance hot spot of 10,531 milliseconds. The first column shows you that this was the total amount of time spent in the enterAProgrammaticTrance() method.
If you look at the value in brackets, it shows that 99.8% of our program's time was spent in that method. The last column, Invocations, shows that it was called only once.
Now, what could that method be doing? Remember that this program has been interpreted from the ancient spells of alchemists. In short, don't expect too much reason behind some of our business rules. Let's read the comments and look at the code.
private void enterAProgrammaticTrance() {
        // Slows down the magic
        Instant before = Instant.now();
        Instant end = before.plus(Duration.ofSeconds(10));

        while (Instant.now().isBefore(end)) {
            for (int j = 0; j < Integer.MAX_VALUE; j++) {
                for (int i = 0; i < Integer.MAX_VALUE; i++) {
                    // TODO - implement
                }
            }
        }
    }
Can you see what it does? Or rather, what it doesn't do?
The code has a while loop at Line 6, which keeps checking to see if 10 seconds have elapsed since the Instant end was calculated at Line 4. There are two big nested for loops after this at Lines 7 and 8, but they don't do anything! There's an unhelpful TODO comment at Line 9.
Essentially, this just loops for 10 seconds!
It's not clear what this code should do either. On asking our dragon subject matter experts (SME's), we are told that they don't need a business rule like this one. We can remove this code without harming the application. It's better to get saddle estimates back in under 10 seconds than enter a programmatic trance.
Try it Out for Yourself!
A fix is required!
Try to reproduce our steps above. You should see the enterAProgrammaticTrance in the Hot Spots view.
Remove this method and the call to it.
Once you've done that, you can try profiling it yourself, as we did above.
When you are in the Hot Spots view, you should notice that
enterAProgrammaticTrance()is no longer at the top.
Check out the branch performance-bug-fix to see the solution:
git checkout performance-bug-fix
When I run the application using VisualVM's Hot Spot view, the slow method has been visibly removed and the main method is the new slowest at about 19 ms.

Let's Recap!
Profiling allows you to collect and examine metrics about the performance of the classes and methods in your program.
Using VisualVM you can profile your applications and capture sorted views of performance Hot Spots in your code.
Using the Startup Profiler plugin, you can inspect short-lived programs.
In the next chapter, we'll explore another great tool - JConsole!
