Explore Key Indicators in Your Code With JConsole
Managing the Health of Your Code With JMX
Have you ever gone to the doctor and had your temperature taken, pulse and blood pressure measured, and eyes checked?
Your doctor is usually examining your health by checking a few easy-to-measure key indicators. 🌡️ These measures can help summarize the overall state of your health without having to cut you open! 😷💀
When real users utilize your application, you want to know that everything is working as it should with no surprises. You also want to do this in a non-intrusive way, so you don't slow down, stop, modify, or restart your application while you check that it's working. This is where Java Management Extensions, more commonly known as JMX, come to the rescue!
JMX provides a standard interface for applications to report on their own health (in other words, how well they're working). Have you ever used a third-party library in your code? If so, without even knowing it, you've likely enabled JMX extensions, which give you information about application health, including metrics relating to things such as your operating system and memory utilization. This information helps diagnose and treat bugs.
How does this work exactly?
To understand JMX, you need to know what it's made out of: attributes and operations.
Using Attributes With JMX
JMX allows applications to code special endpoints that make information available about different values. These are called attributes and describe how your application is running - like the health checks and medical history done by the doctor.
Java provides you with information. For example, it could tell you how much free memory is available on the computer running your application's JVM. Value can include a memory change in time as your computer grows and requires more memory to solve its problems. You can track how this grows over time, giving you metrics you can see on a graph.
Other attributes might be fixed and unchanging, such as the name of the operating system. This is metadata, which helps describe your system in broader terms and gives context to the metrics. Fixed information, like what JVM you're using, could be useful when tracking differences in how memory and other resources are used between different JVM versions.
Using Operations With JMX
JMX also allows application endpoints to make special methods available. This enables you to use the same tools that inspect your application's metrics to call special methods which could change your application without restarting it. For example, you could ask your application to be more chatty when it reports about what it is doing.
You're saying that my application may already have health metrics? How do I see them?
JConsole is a tool supplied with both the OpenJDK and Oracle JDKs. You can use it to connect to a JVM running your application and inspect the health metrics via operations and attributes. Let's check it out!
Connect to JConsole and Inspect an Application
Step 1: Start Up an Application
You can usually find JConsole by displaying your JAVA_HOME environment variable and looking under the bin folder stored there. This differs from distro to distro. Try to look under the following locations:
On a Mac running OS-X, you'll find your Java distribution under
/Library/Java/JavaVirtualMachines.On Windows, you'll typically find your Java installs under
c:\Program Files\Java.On Debian Linux distros, you will find your dpkg installed JDK under
/usr/lib/jvm.
Have a look under the bin directory of your JDK installation for the JConsole application binary. The DragonSaddleSize guesser runs using JDK 8, so on Windows, it would look like:
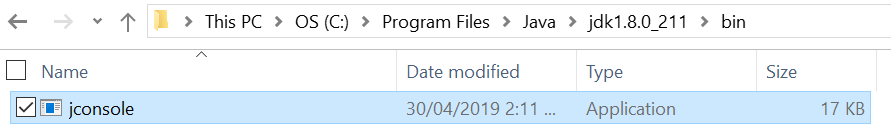
Try running JConsole and get it to connect to itself. Have a poke around after it connects.
As with VisualVM, it's fun connecting JConsole to itself, but the tool shines when you can start using it to inspect your application. We're going to run a version of our DragonSaddleSizeGuesser, which reports this year's estimated saddle size for a dragon born in AD 1. Since you'll work quite a bit on Spring Boot as a Java developer, I've made you an application that runs as a Spring Boot web-application. While JConsole can be used with lots of Java tools, working on it within Spring Boot will give you some realistic practice. 😎
Let's look at the branch with our web application and start it up! Go back to the Dragon Saddle Size Guesser, and check out the spring-application-with-actuator branch. We'll start it up in IntelliJ. From the command line, you can:
git checkout spring-application-with-actuator
Let's examine the branch together in IntelliJ and start the application. I'll also show you around:
As you saw:
We checked out the branch and then used the Gradle menu to start the app by clicking on bootRun.
We were then able to visit http://localhost:9999/dragon/size in our web browser to get an estimate for the current year.
What’s special about this version of the application?
On this branch, your Dragon Saddle Size Guesser application has been converted into a simple web application so you can go to a URL in a browser and get back a saddle size estimate. The project is not only a Spring application, but it also has an added dependency of org.springframework.boot:spring-boot-starter-actuator, known as Spring Actuator, in its build.gradle file. Including this dependency in a Spring project introduces reporting against your web application. This is what we'll be taking a look at with JConsole.
Step 2: Use JConsole to Inspect Your App's Metrics
To check out an app's metrics, start JConsole and select Connection and New Connect. This shows a list of Java processes you can connect to. Let's find the DragonSaddleSizeGuesserApp, connect to that, and examine the screen we're presented with:
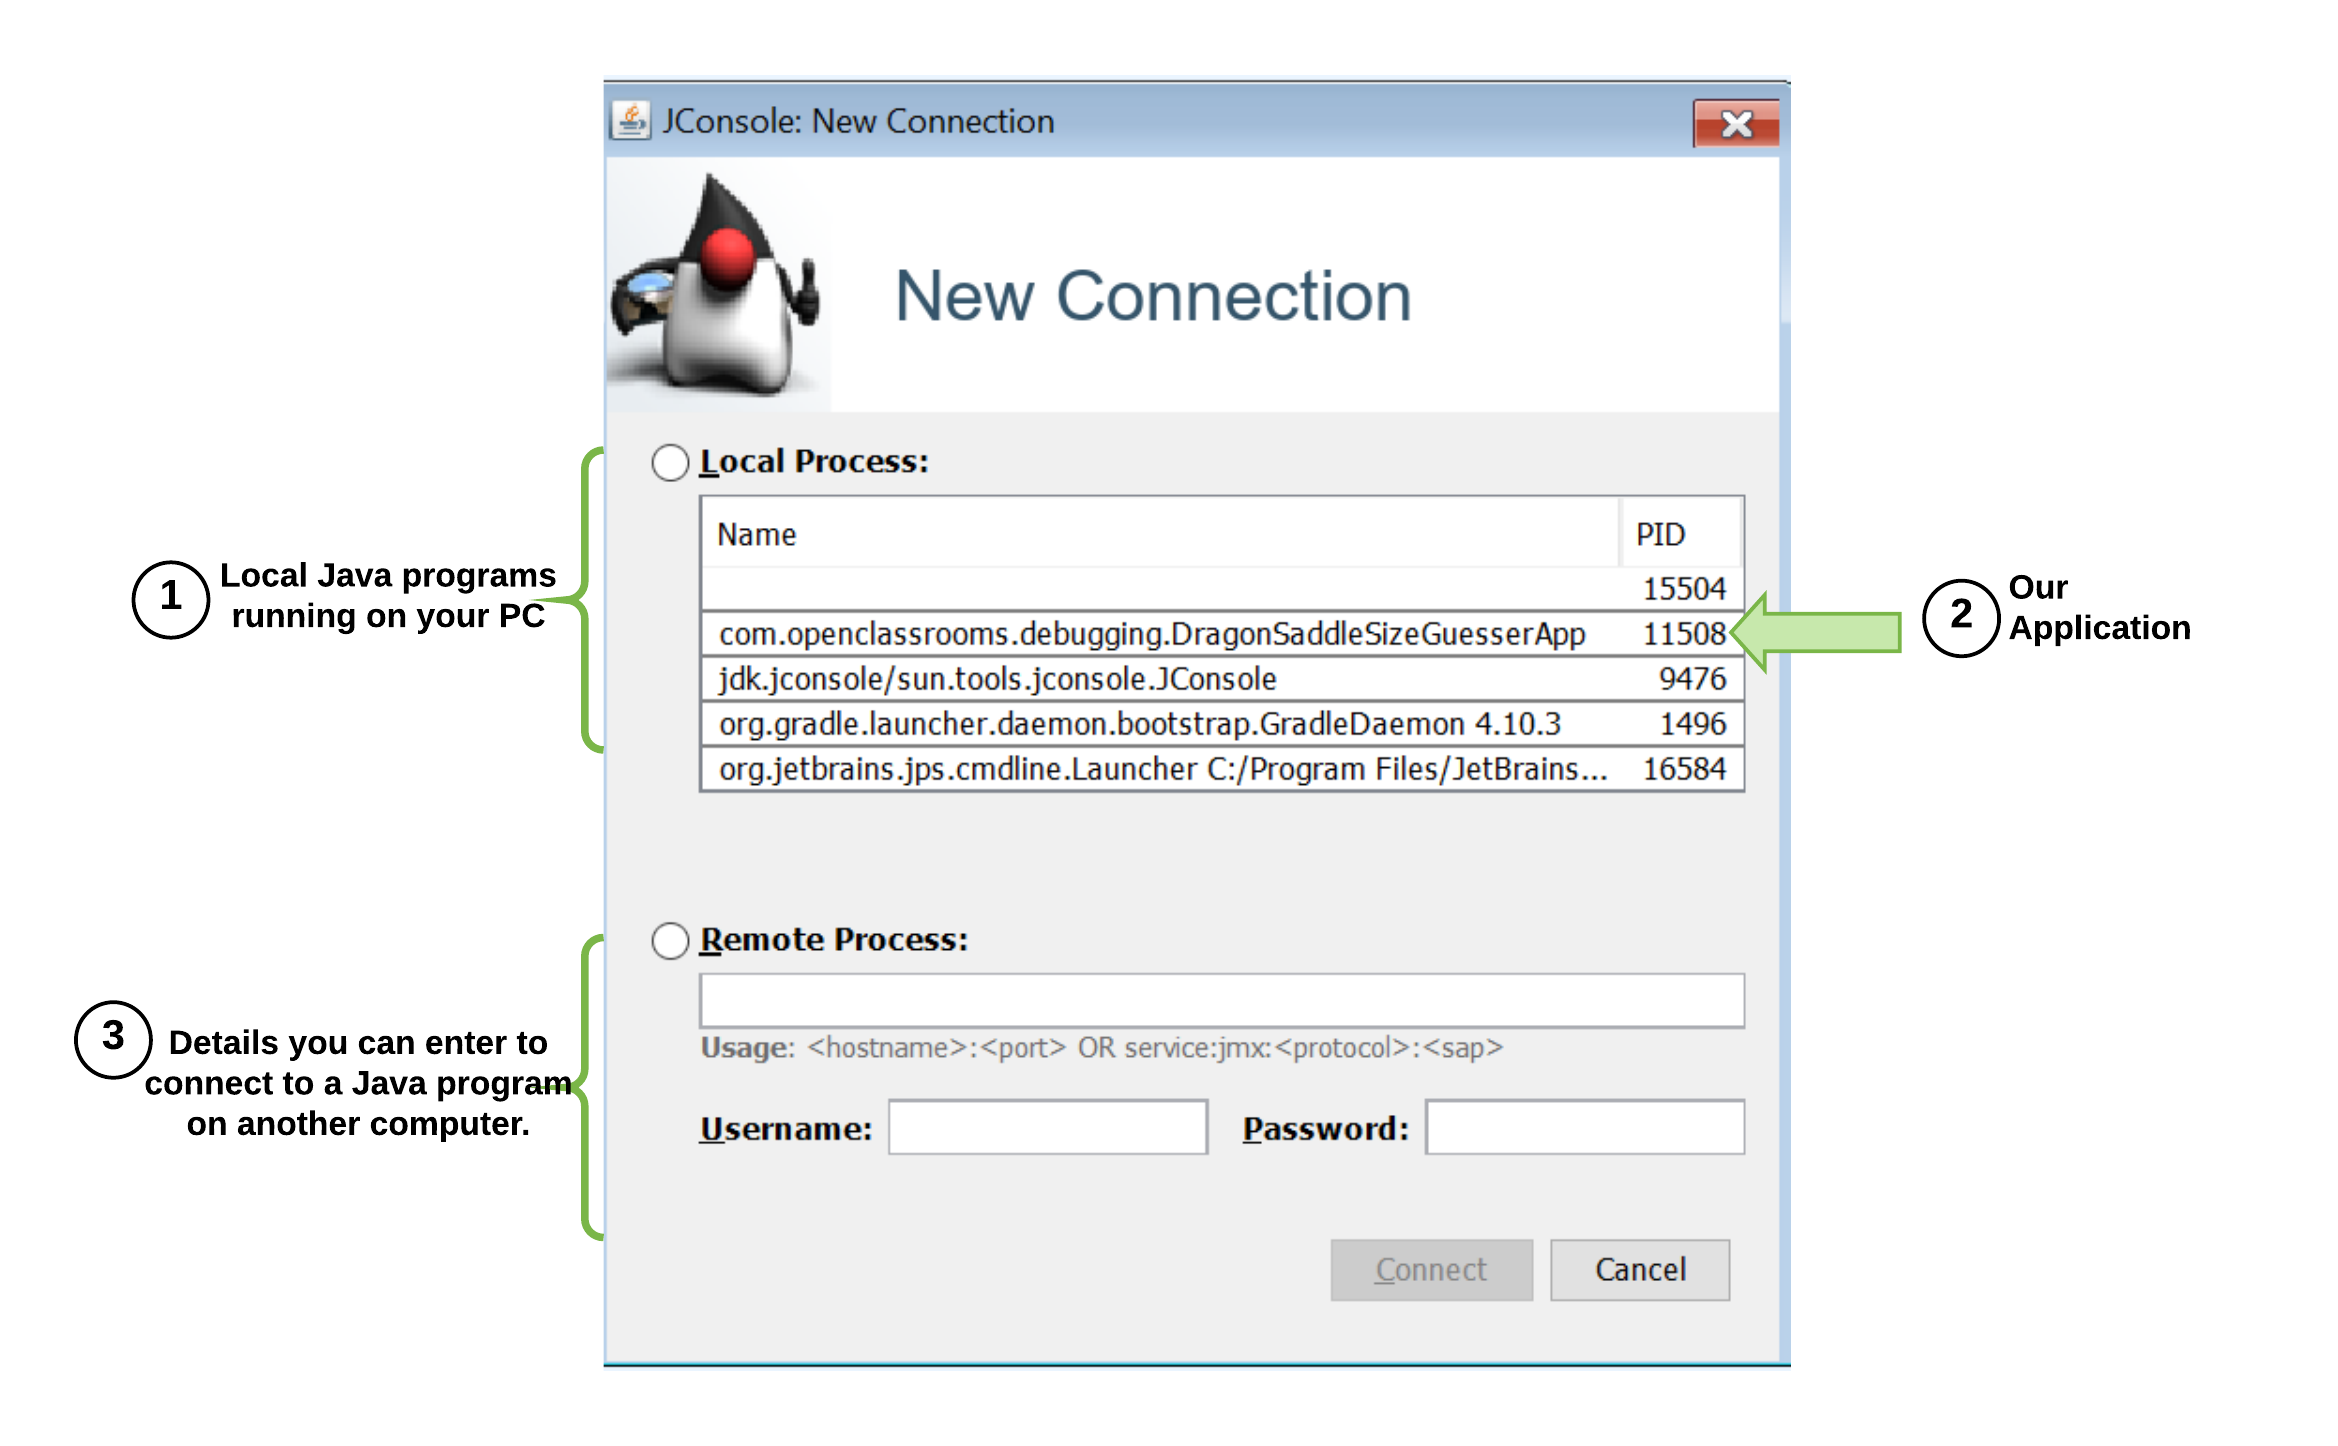
Let's break this down:
TheLocal Processessection shows all the Java processes running on the PC where you started JConsole.
After starting our application, you'll see our DragonSaddleSizeGuesserApp under Local Processes, the name of the main class of our application. Thendouble-click on this to connect.
At the bottom under Remote Process, you can connect to the JMX part of any Java program on any computer you can reach over a network without firewalls in the way, of course. You can learn more about this here.
Let's use this to connect to our DragonSaddleSize guesser and see some of the metrics and reference data it exposes and shows us.
Our main focus when using JConsole is theMBeanstab. This is where Java classes publish the metrics that give you insights into what is going on inside the JVM.
As you have seen, there are many different metrics made available by Spring Actuator, as well as a myriad of other libraries on which your application depends. These are grouped by meaningful keys called ObjectNames.
Let's have a look at what JConsole shows you under MBeans:
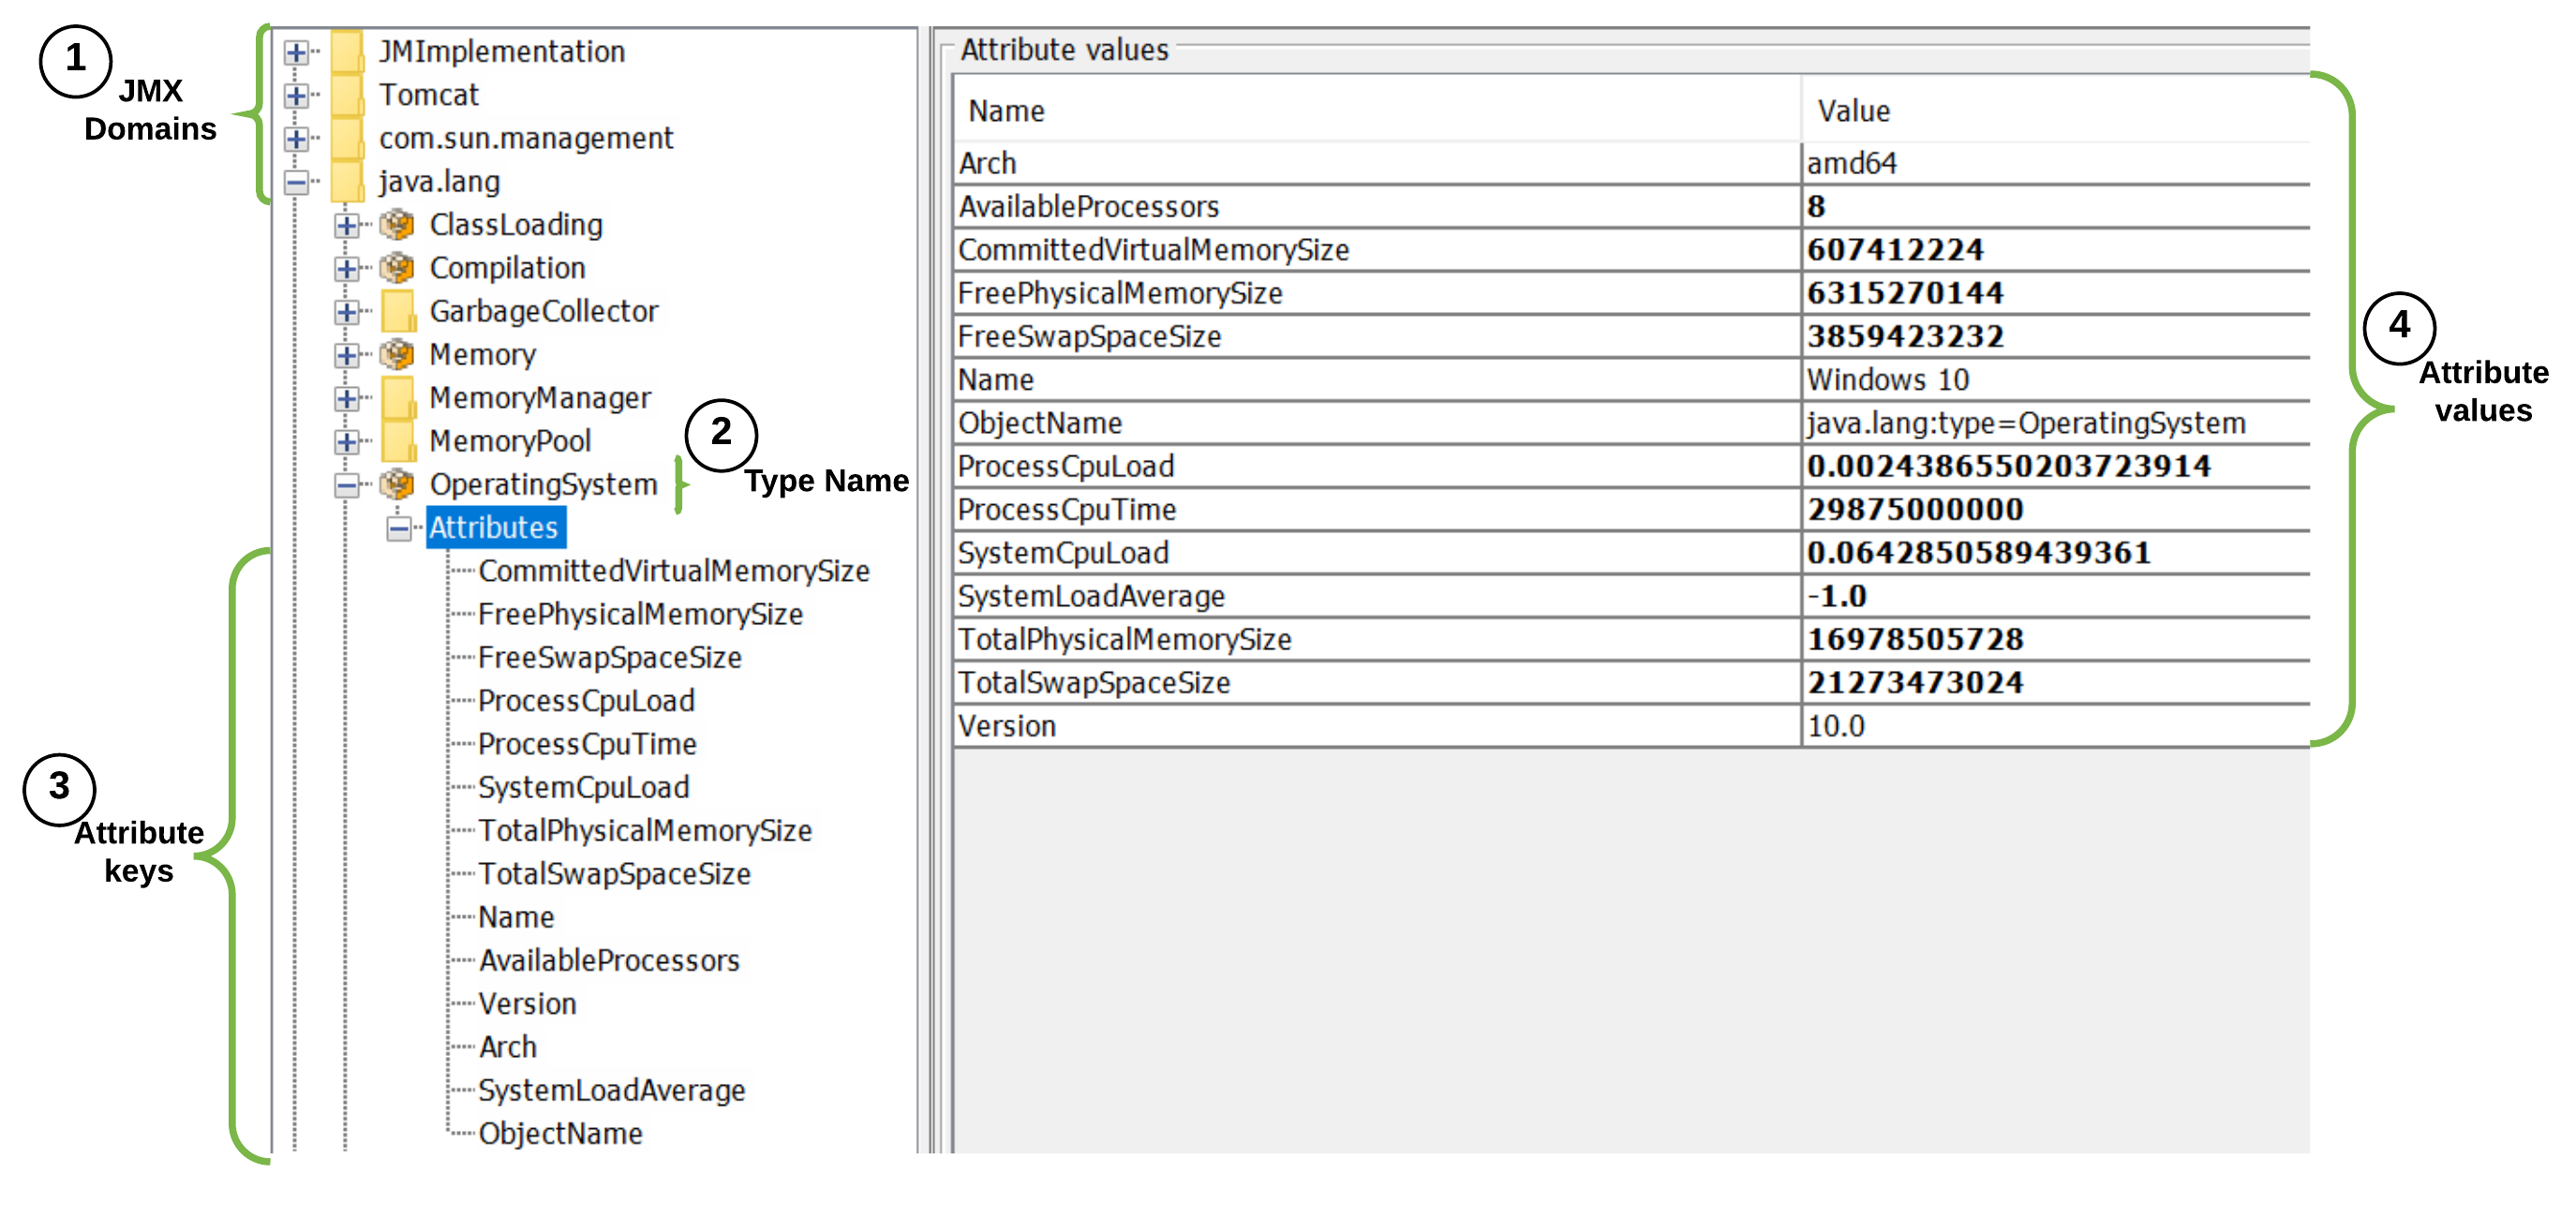
As you can see, the ObjectName's form is structured into folders you can navigate.
Let's explore them:
The yellow folders form the domain part of the ObjectName and help you group different attributes. As you can see, Java publishes a bunch of useful attributes under the java.lang domain.
Special keys group attributes and operations under a more specific type. This type describes their nature more clearly than the domain. For instance, all details retrieved directly from the Windows or OS-X operating system your JVM is running on, are grouped under the type Operating System.
If you look into the details of the type, it shows Attributes and Operations. Under Attributes, you can see the names of attributes on which our application is reporting. These are also known as keys. For example, FreePhysicalMemory size, which you can see above, is the key describing how much free memory your computer has left.
On the right of your attributes, you can see pairs of keys with their last reported values. In most cases, these will represent something close to the current value.
There are many ObjectNames, attributes, and operations exposed by your typical application. The ones I showed you in the demonstration are a good start as they give you a feel for how your application is running, but that's just skimming the surface.
If you just want to know how well your Spring application is performing, you can focus on the branch labeled org.springframework.boot/Endpoint which was given by Spring Boot Actuator. All the operations and attributes under this are intended to give you greater visibility of a Spring application. Looking at the health endpoint should show you that your application has started up correctly.
As you saw, setting the property showed that the code was an older version and should be upgraded. In a more complex situation, you might have to dig deeper and play Sherlock again, using the clues in your application, like logs (which you'll learn about in a following chapter).
Let's Recap!
Java Management Extensions, or JMX, provide a protocol that tools can use for monitoring and managing your Java applications.
MBeans are special classes that applications can provide to report on themselves and allow special management operations to be carried out.
Attributes consist of a value and a key that describes that value. MBeans use attributes to report on aspects of your application.
Operations are special actions you can perform by using MBeans. An example of this might be to change a log level or clear out a cache.
JConsole is a tool that comes with the JDK and is designed to help you interact with MBeans on either a local or remote Java process.
Spring Actuator is a library that allows Spring applications to manage MBeans through the application itself without the need for other tools.
In the next chapter, we'll take a look at another powerful tool: logging!
