Understand the Logistic Regression Algorithm
Logistic Regression
In the previous chapter, we looked at how a classification task (predicting high or low happiness) can be carried out by building a decision tree. But decision trees are not the only algorithm you can use for classification! In this chapter, we will look at another algorithm, logistic regression.
But First - Linear Regression
Before we dive into logistic regression, let’s look at its cousin, linear regression. We will be taking a deeper look at linear regression in the next part of this course. But for now, you need to know just enough to help you understand logistic regression.
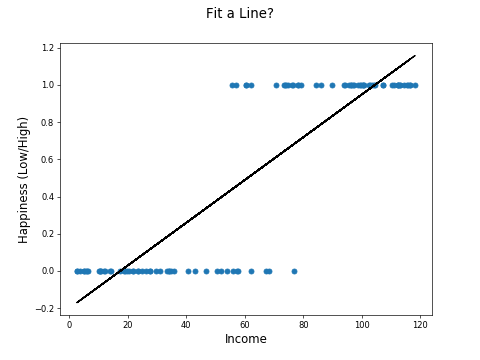
Take a look at the following scatter plot showing income against happiness for 100 countries.
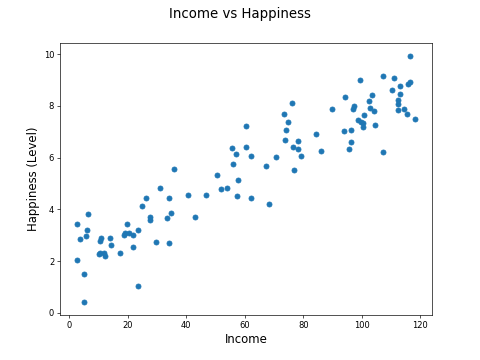
The mean income per person is measured in thousands of dollars. The happiness is measured by a survey, with each country accumulating a score between 0 and 10, with 0 being deeply unhappy, and 10 being incredibly happy.
We can fit a line to this data:
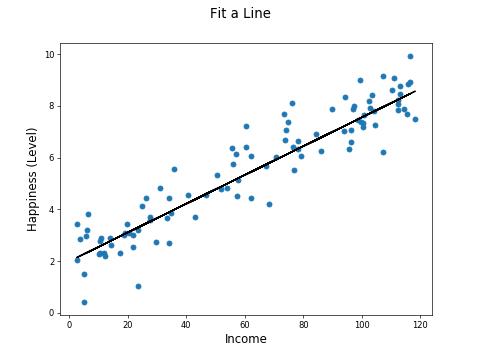
You will see how this line is fit when we look at regression in the next part of this course. You may be familiar with the general idea of fitting a line to a plot of sample points. You may have done this when analyzing the results of a science experiment at school!
The fitted line gives a feature you can use to predict happiness from income levels. For example, a country with a mean income of $70,000 per person has a predicted happiness rating of 5.9:
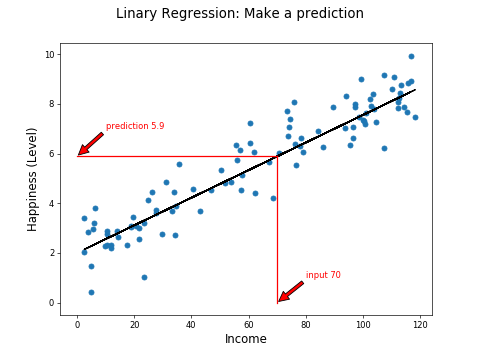
We've built a linear regression model!
Binomial Logistic Regression
Instead of a happiness value between 0 and 10, what if we measured countries just with high and low happiness, as in the example in Part 1 of this course?
The plot would look more like this:
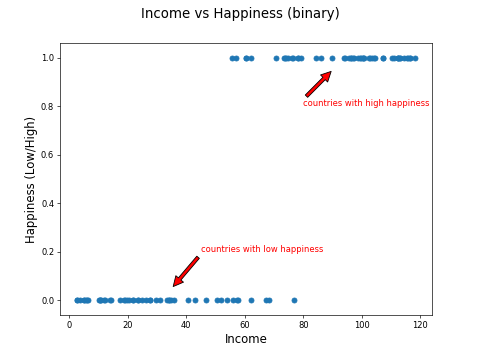
The machine learning task now is to use income to predict high or low happiness. But the relationship is not linear, so you can't just fit a line like this:
Consider three areas of the chart: One where the countries with income < $40k are low happiness, another where countries with income > $90k are high happiness, and another, where for countries between are less clear-cut:
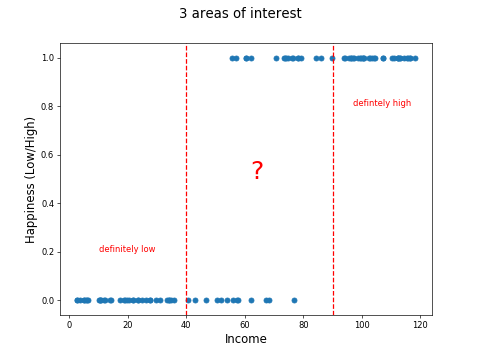
A straight line can't model this relationship, but what if you could do this:
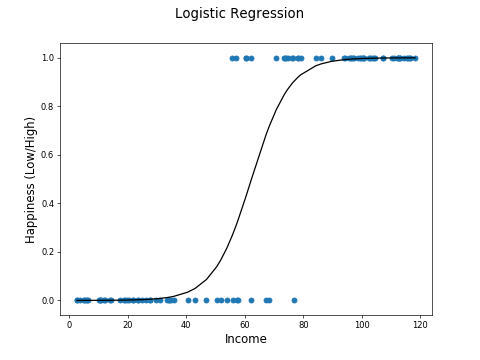
This is exactly what logistic regression does!
The curve is called a sigmoid curve, because it is S shaped.
You can use this curve to obtain a probability of a low or high classification. Here we have an 88% probability of high happiness for a country with a mean income of $75,000.
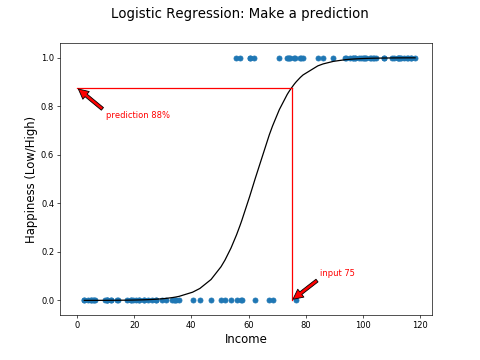
Now we can use a threshold of 50% to make a hard high or low prediction.
Multinomial Logistic Regression
What if there are more than two classes? For example, what if we split the countries into high, medium, and low happiness?
There are a few strategies for dealing with this. The one-vs-rest (OVR) algorithm trains a model for each class against the others. So you would train the following models:
High vs. medium and low
Medium vs. high and low
Low vs. high and medium
Recap
Logistic regression is a regression algorithm. Regression helps predict continuous variables.
With logistic regression, the continuous variable is the probability of a categorial prediction.
Binomial Logistic Regression predicts one of two categories.
Multinomial Logistic Regression makes predictions when there are more than two categories.
In the next chapter, we will build and evaluate a classification model.
