Understand the KNN Algorithm
K-Nearest Neighbors (KNN)
In the previous chapter, we looked at linear regression as an algorithm for building models to predict a continuous numeric feature, such as the happiness level of individuals on a scale of 0 to 10.
Now let's look at another algorithm, k-nearest neighbors, or KNN. This is an easy algorithm to understand!
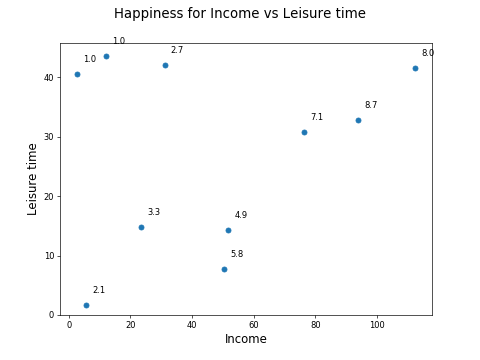
The following dataset shows the income, percentage of leisure time, and a self-rated happiness score for a group of individuals:
income | leisuretime | happiness |
5.6 | 1.7 | 2.1 |
93.8 | 32.8 | 8.7 |
12 | 43.6 | 1 |
76.3 | 30.8 | 7.1 |
2.7 | 40.6 | 1 |
112.4 | 41.5 | 8 |
51.8 | 14.3 | 4.9 |
31.1 | 42 | 2.7 |
23.6 | 14.8 | 3.3 |
50.4 | 7.8 | 5.8 |
We can plot these three features on a scatter plot with income on x, leisuretime on y, and happiness as a label on each point:
Now, let's say we have two new individuals for which we know the income and leisure time:
income | leisuretime |
80 | 25 |
40 | 10 |
We can plot them on the chart, marked by the x and + here:
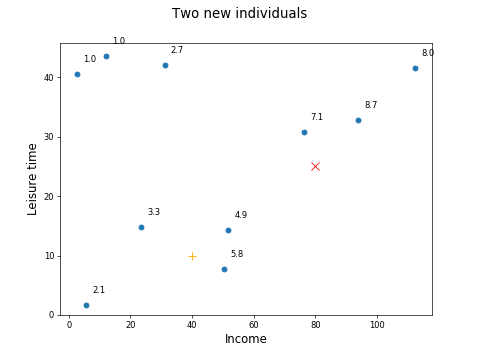
How can we predict the happiness of the two individuals given their income and leisure time?
Looking at the chart, you might guess that X has fairly high happiness, maybe around 6, and + has fairly low happiness, maybe around 4 or 5. Why? Because X is near other individuals who have a high happiness level, and + is near other individuals who have a low happiness level.
The KNN algorithm works in exactly this way! You can look at the three nearest points, or neighbors, to each point you want to predict:
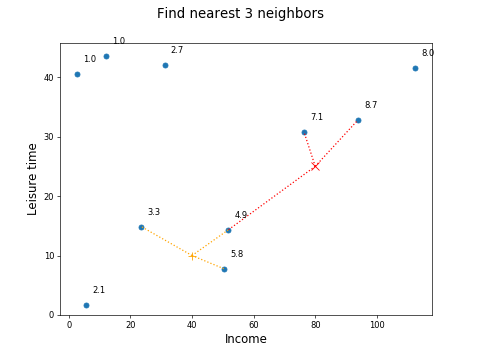
Then work out the average happiness level for the three neighbors:
Point X:
Average happiness = (7.07 + 8.66 + 4.92) / 3 = 6.9
Point +:
Average happiness = (3.31 + 4.92 + 5.81) / 3 = 4.7
These are the predictions for happiness for points X and +!
The K in KNN
In the above example, we looked at three neighbors of an individual to predict their happiness. The k in KNN is the number of neighbors we examine, so in this case, k=3. We could have chosen 5 or 10, or some other number. In reality, we will probably want to try out different values for k, and see which gives the best model performance (i.e., the smallest total error between the predictions and the actuals in our test set).
The NN in KNN
What does "look at the three nearest neighbors" mean? How can you compute them?
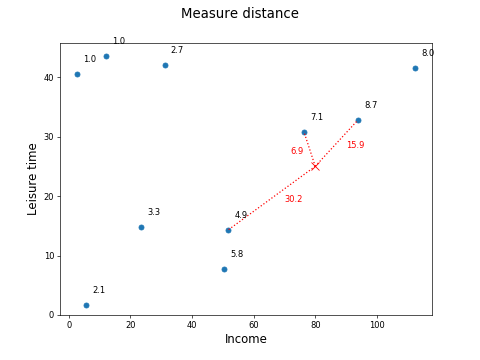
We are talking about the distance from one data point to another. There are various measures of a distance you can use, but one of the simplest and most common is the Euclidean distance.
If you have taken previous courses in this series, you will have encountered this concept before. As a brief reminder, to compute the Euclidean distance between these two points:
income | leisuretime |
80 | 25 |
93.8 | 32.8 |
Compute:
Which gives a Euclidean distance of 15.9.
In this way, you can measure the distance of all three neighbors of point X:
Weighting
In the above example, to compute the happiness of a new point given its three closest neighbors, we took the average happiness of the neighbors:
Point X:
Average happiness = (7.07 + 8.66 + 4.92) / 3 = 6.9
In this case, all neighbors have been given equal weight.
Wouldn't it make sense to give more weight to closer neighbors?
To do that, weight each neighbor by the inverse of the distance from the examined point. Here is the calculation of happiness for point X using weighted distances:
income | leisuretime | distance to point X (80,25) | happiness | inverse distance (1/distance) | weighted happiness |
93.8 | 32.8 | 15.9 | 8.7 | 0.063 | 2.3 |
76.3 | 30.8 | 6.9 | 7.1 | 0.145 | 4.3 |
51.8 | 14.3 | 30.2 | 4.9 | 0.033 | 0.7 |
Total |
|
|
| 0.242 | 7.2 |
For this example, using weighted distances gives a higher happiness score than using unweighted distances, because the closest of the three neighbors have higher happiness.
Recap
K-nearest neighbors (KNN) is another regression algorithm to predict continuous numeric features.
KNN looks at the k-closest neighbors to the sample point being investigated, using a distance measure (e.g., Euclidean distance) to find the closest neighbors.
It takes the average value of the target feature for the k-neighbors as the predicted value for the sample point being investigated.
You can optionally weight the closer of the k-neighbors higher than those further away.
In the next chapter, we will build and evaluate a regression model!
