Understand How Convolutional Neural Networks Work
 In this part, you will learn a few new architectures that will allow your networks to learn faster and with better accuracy.
Understand When To Use Convolutional Neural Networks
CNNs have been very successful in computer vision applications, and some early work suggests that they can also be used on graphs.
To better understand how CNNs operate, we will use the example of an image:
The image above is black and white, and the whole image is stored in the computer as a big table. In the table, white cells contain the value 255 and black cells 0.
Let’s take a look at one such table:
0 | 0 | 255 | 255 | 255 | 255 |
255 | 0 | 0 | 255 | 255 | 255 |
255 | 255 | 0 | 0 | 255 | 255 |
255 | 255 | 255 | 0 | 0 | 255 |
255 | 255 | 255 | 255 | 0 | 0 |
In the table, it’s quite easy to spot a line of 0s going from the top left to the bottom right. It means that the image has a black line through it.
Every cell in the table is called a pixel. Now you know what it means when someone tells you that one cellphone’s camera has more megapixels than another. It’s because the size of the table where the image is stored is bigger.
When training machine learning algorithms on images, every image is a single data point. Every image is stored as a large table. Previous datasets you worked on in this course held all the information about a single data point in one row:
To detect pizza types, all the ingredients in that pizza were in that one row.
To detect traffic, all the traffic data for one point in time was in one row.
Sure, you could convert the image data point from a table to a row (i.e. flatten the data):
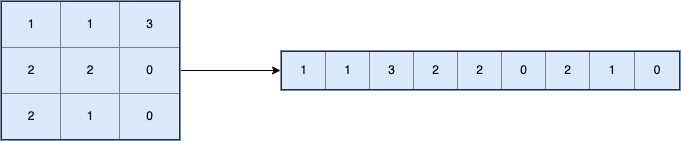
But if, you did this, you would lose helpful information about the relative closeness of some pixels. For example, because of how flattening works (rows append to one another), some pixels that are actually close to each other appear further apart.
Here is where convolutional networks shine through their filters. :magicien:
Understand How Filters Work
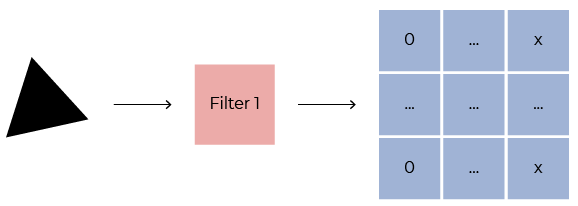
Imagine this filter as a detective with a small magnifying glass who breaks the full input image into small parts and slowly scans it to find information. Still unclear? Check out the image below:
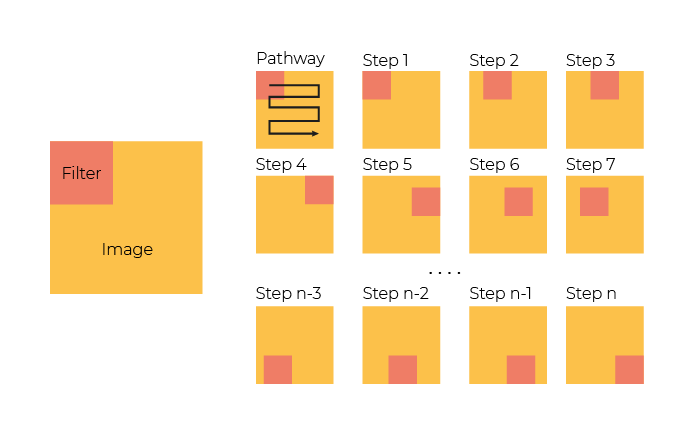
The detective has their own separate output image, a bit smaller than the original, which you can consider blank. If the detective finds something they were trained to look for, they will mark it in the output image. For example, a detective trained to detect horizontal lines will mark them in the output image when they find them, but will not be interested in vertical lines.
You can control a parameter called the stride, which tells the detective how far from its current area it should go next. Let’s leave it set to 1 for now.
After applying a convolutional filter, the size of the resulting table/output image is calculated as follows:
Resulting image height = (image height - filter height) / stride + 1.
Resulting image width = (image width - filter width) / stride + 1.
When you train the filters in the convolutional layer, you are essentially training the detectives.
The convolutional layer creates quite a lot of information. You start with one image and end up with as many tables/images as there are filters and almost the same number of pixels. The convolutional layer has helped extract information from the image, but it needs to be simplified further.
Describe What Pooling Layers Are
A commonly used layer after a convolutional one is pooling. Pooling layers help compress the information about the shapes detected into fewer pixels. The filters in the convolutional layer will record information for every pixel in the input image, but the shapes they detect usually span multiple neighboring pixels - a line is sometimes a few pixels wide and a few pixels long.
Pooling layers scan the entire image that the convolutional layer produced. However, they do simpler operations of taking the maximum value they observe (max pooling) or averaging the data (average pooling).
Max pooling is probably the most common type you will see:
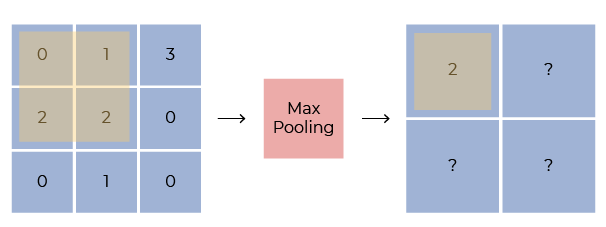
Above, the max pooling layer looks at the top-left quadrant and tries to find the maximum value, which is 2. It notes that down.
Look at the top-right quadrant. The one that has the values:
1 | 3 |
2 | 0 |
Here, the maximum value is 3, and that’s what max pooling layer will select.
Pooling layers also record their results in tables/images. Their size is normally calculated as follows:
Resulting image height = (image height - size of the pooling layer) / stride + 1.
Resulting image width = (image width - size of the pooling layer) / stride + 1.
Usually, multiple layers of convolutions and pooling are used in a network. Early on in the network, these layers can learn to detect simpler shapes such as lines and corners, and later on, they start detecting complex objects.
Let’s Recap!
Convolutional neural networks work by scanning areas of a data point to understand essential features.
They work best in situations where the data can be broken down into parts that individually hold important information. An example is an image where information could be corners or lines in certain parts of the image.
They usually are built using:
Convolutional layers that act as filters that check the entire image for information.
Pooling layers that further act to compress the information. Pooling layers aggregate the convolutional layers’ results by doing operations such as selecting the max value in an area (max pooling) or averaging values (average pooling).
These layers usually follow each other as a group, and it is quite common to see multiple groups.
But enough talking, let’s try this out for ourselves! Ready to build your own CNN? Let’s do it!
