Use Automated Testing Tools
Understand the Limits of Automated Testing
Automated tools can be great as a quick check! But their capabilities are minimal. They can only test for what is machine-checkable, and even then, they can’t use their judgment to make a meaningful conclusion. For example, an automated checker can identify if an image is missing alternative text. But some content management systems will automatically use the image file name as an alt text attribute. In this case, the image would pass the check even though the description communicated to the user could be something like “IMG3334.PNG.” Hardly useful! Similarly, a checker can’t know if your heading structure is meaningful, even if it’s present. Or if the markup is appropriate for the content, as long as it’s structured correctly.
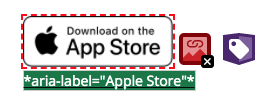
In some cases, the checker will also flag issues that, in actuality, don’t pose any barriers. For example, when I ran a WebAIM WAVE check on an OpenClassrooms page, an error came up about missing alternative text for an image link.
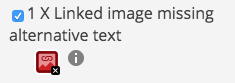
However, when I looked at where the error was occurring, I could see that this image link had an aria-label, a different method for describing assistive technologies. Because the label is there, missing alternative text isn’t an issue in this case.
There are also many accessibility issues that a checker can’t test for. For example, it won’t be able to tell you if the site is using color as a way of communicating information, or if your instructions rely on sensory cues. It’s good practice to run automated checks to see what kinds of issues come up, but then remember that all the results need to be manually checked because you’re likely to get both false positives and false negatives. And keep in mind that the work doesn’t end there.
Examples of Automated Tools (WAVE, axe)
WebAIM WAVE Toolbar
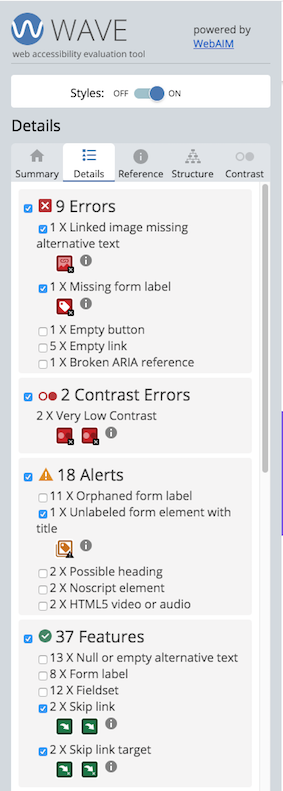
First, let’s look at WAVE. The benefit of this tool is that it visually displays errors where they occur, so you can quickly see them on the page. In addition to errors and warnings, it also shows structural elements present on the page and where ARIA is used.
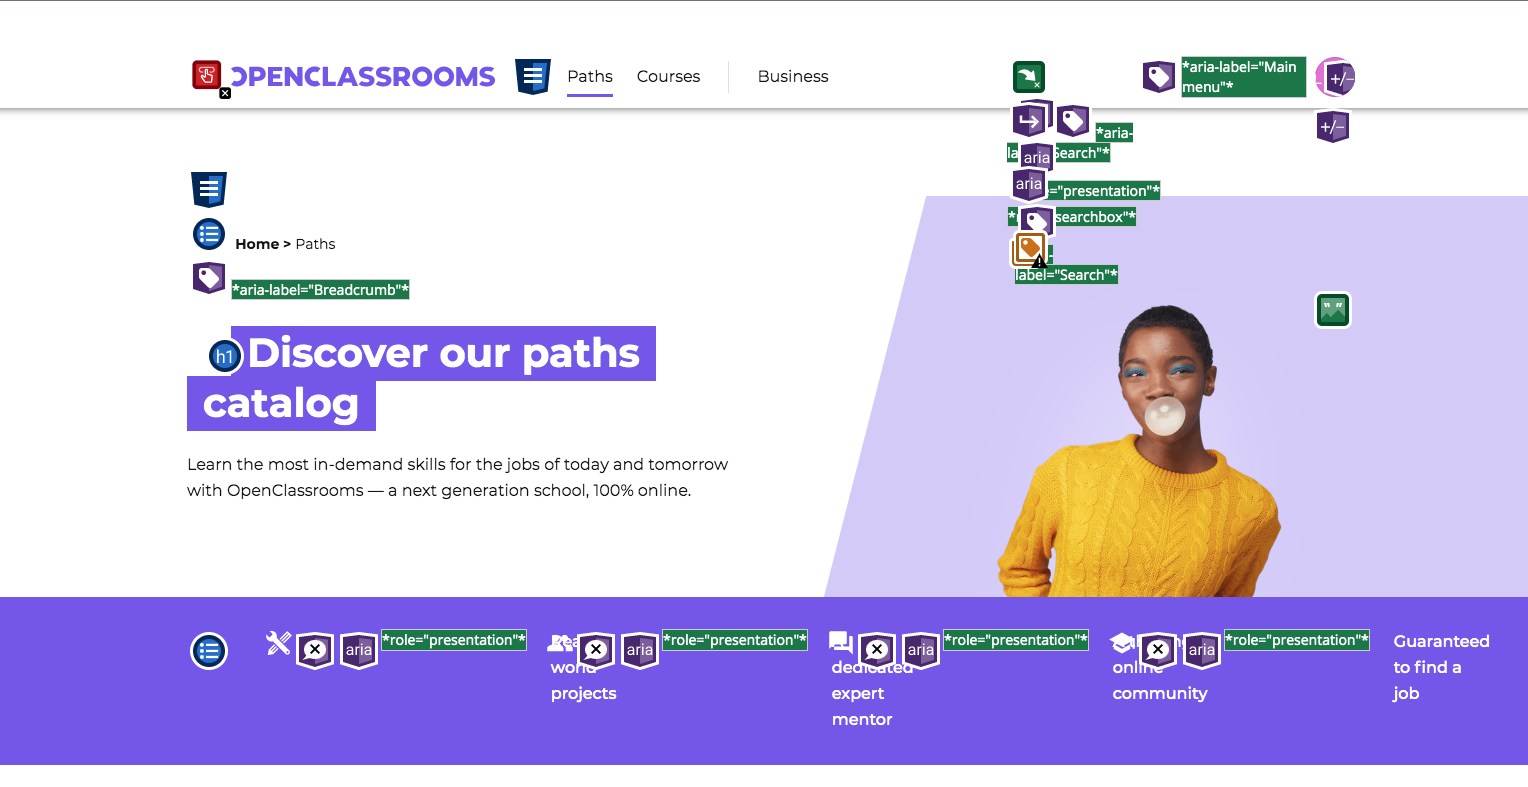
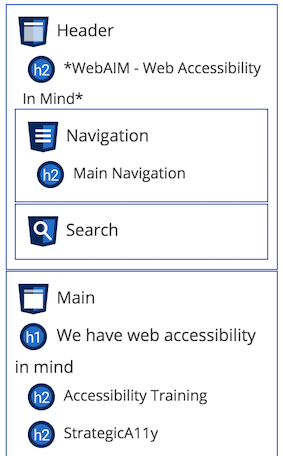
The structure page is helpful for understanding how the page content is organized. This will impact how well AT users are able to navigate the page.
The downside is that because it displays errors visually, it injects these elements into the markup. As a result, when you dig in a bit deeper, the code for the visual error icons will be sprinkled into the page code, so it becomes difficult to separate the two. You may have to go back and forth between running the page and refreshing it without all of the additional WAVE info, which can be time-consuming and confusing.
Also, the visual clutter sometimes makes things difficult to see, and some information, both WAVE and site content, can be cut off and hard to inspect.
Axe
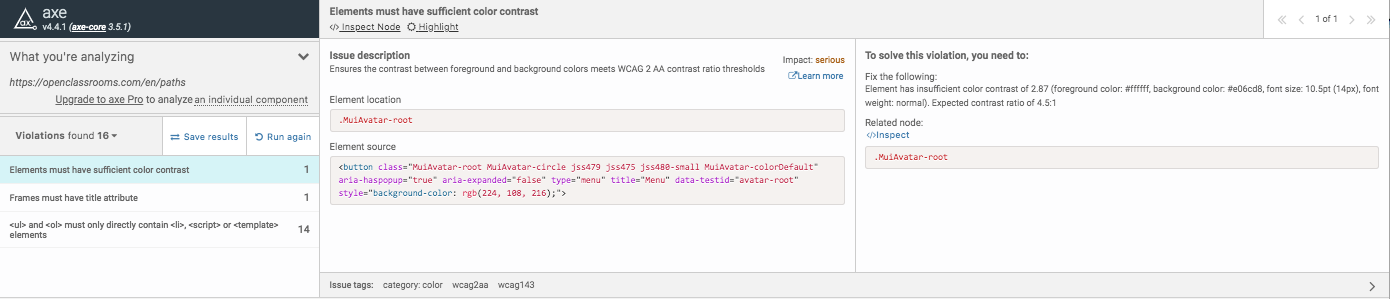
Axe is a bit more on the technical side, and it doesn’t show you the structural features and where ARIA markup is used. Instead, it will present the errors in a list within your inspector tools. The benefit of axe is that you can easily switch back and forth between the list of errors and the code where the errors were found by clicking “inspect node.” For each issue, you can see a more detailed description and tips on fixing it, along with the corresponding code snippet. If there is more than one instance, you can click through each one.
Interpreting Results
For all issues found by automated checkers, make sure to go through them manually before including them in your report. Often you’ll want to add details beyond what’s available within the checker results, like how it may impact the experience and screenshots of where the issue happens. It’s also an excellent way to validate errors you may encounter in your manual and AT testing.
WAVE Results
In the Details tab, you’ll see each individual issue, and you can also toggle different types of information to reduce visual clutter on the page.
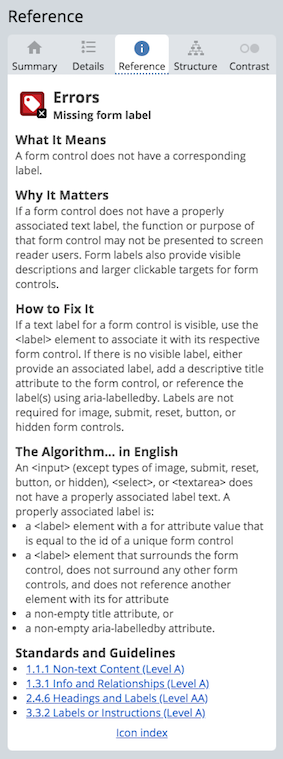
If you click on the information icon next to the issue, details about that error will appear in the Reference tab. The details description will explain why the error is essential, how to fix it, and a link to the related WCAG criterion.
Axe Results
You can read a quick summary of the issue in the Issue Description section, or press the Learn More link for more details. It will redirect you to the Deque website page that provides detailed information about the problem. You can toggle the highlight option to see where the error appears on the page. Make a note of the issue tags at the bottom of the window. These will tell you which WCAG level and the related success criteria.

Exercise: Test Your Pages With an Automated Checker
Go to each of the pages you have selected when setting up your testing session. In Chrome, run each page through the WAVE tool, and axe plugin. Review the findings and summarize them in your report. Remember, not every error necessarily has to go into the report. You may come across false positives, so use your judgment.
Let’s Recap!
Automated testing tools are very limited. Interpreting the results will always require human judgment.
WebAIM WAVE is a more visually-based tool. In addition to errors and warnings, it identifies structural elements features, and ARIA markup.
Axe is more technical in how it presents errors and allows users to easily switch between the list of errors and the source code where they were observed to identify the context and provide further details.
Ready to dive in deeper? Let’s look at some manual checks next. You’ll get a chance to inspect some code and look at the site content and interactions more closely.
