Test Your Code With Chrome and Firefox DevTools
In this chapter, you'll be using the Chrome and Firefox developer tools — affectionately known as the DevTools — to analyze a page from the OpenClassrooms website!
Explore the Inspector - HTML
From an OpenClassrooms web page, find out what the HTML inspector looks like on your web browser:
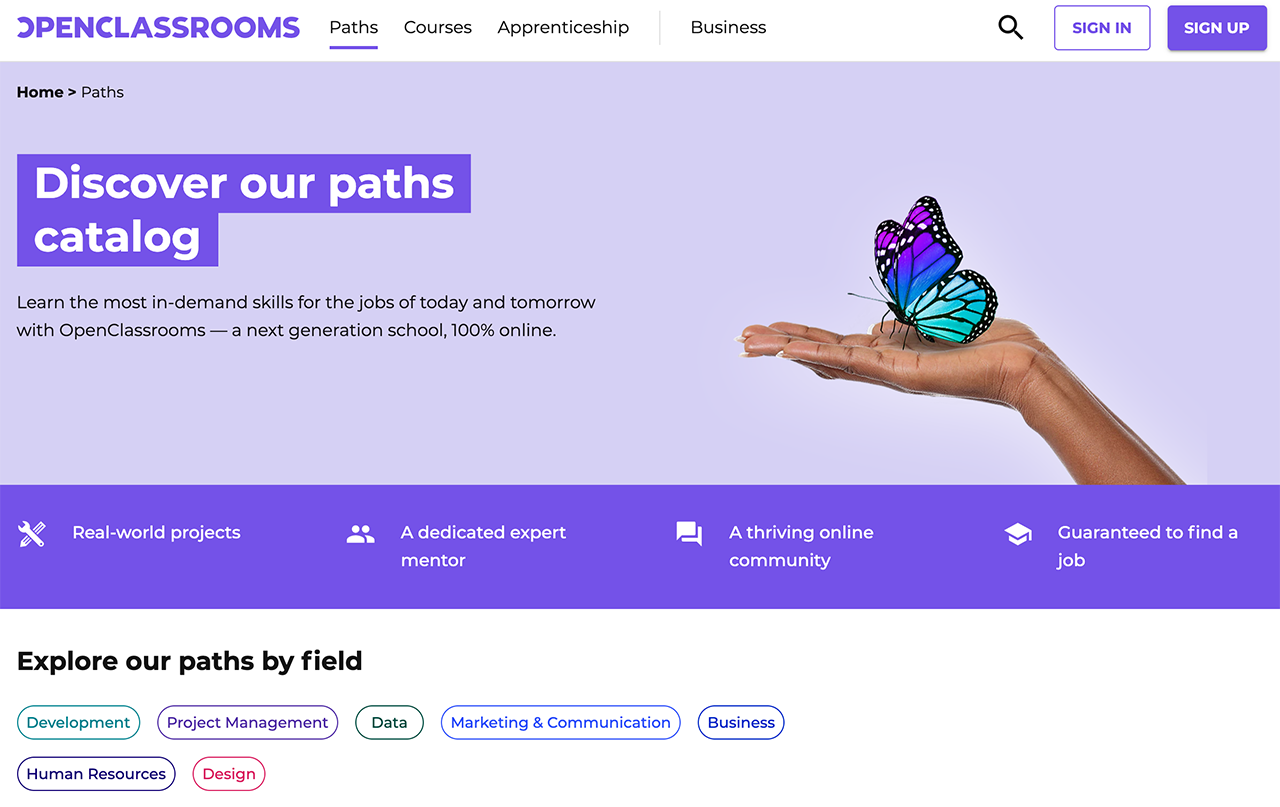
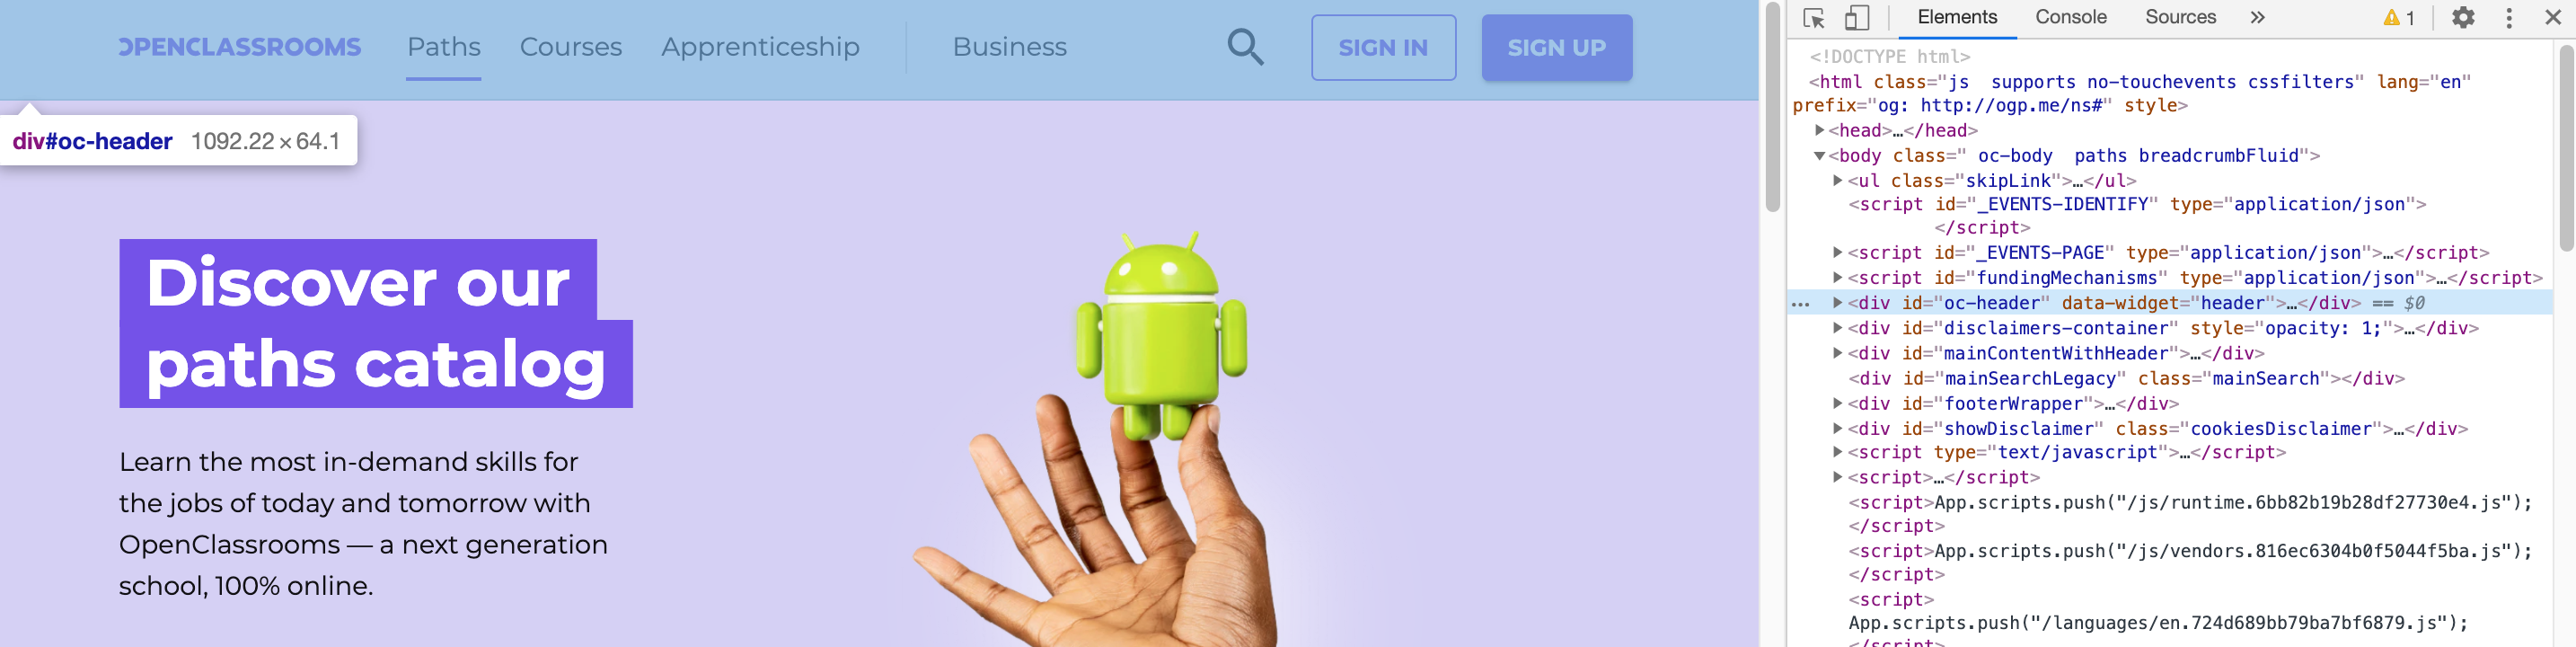
Let's start by opening https://openclassrooms.com/en/paths in Chrome:
To inspect this page's structure, you're going to need the Elements inspector. On Windows, use Ctrl+Shift+C . On macOS, use Option+Cmd+C . The inspector will open at the bottom of your screen.
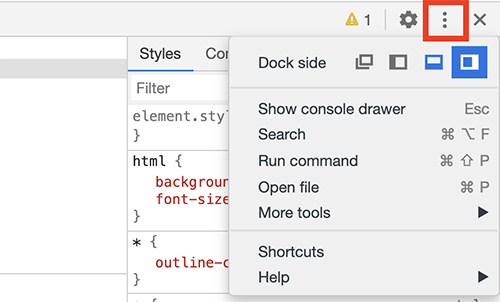
To make things easier to read, I prefer to anchor the DevTools on my screen's right-hand side. You'll find the option in the "Customize and control DevTools" menu:
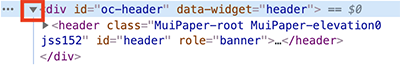
As you hover over various lines of code, the corresponding elements are highlighted on the displayed page. For example, hover over this line:
<div id="oc-header" data-widget="header">...</div>The page header will highlight:
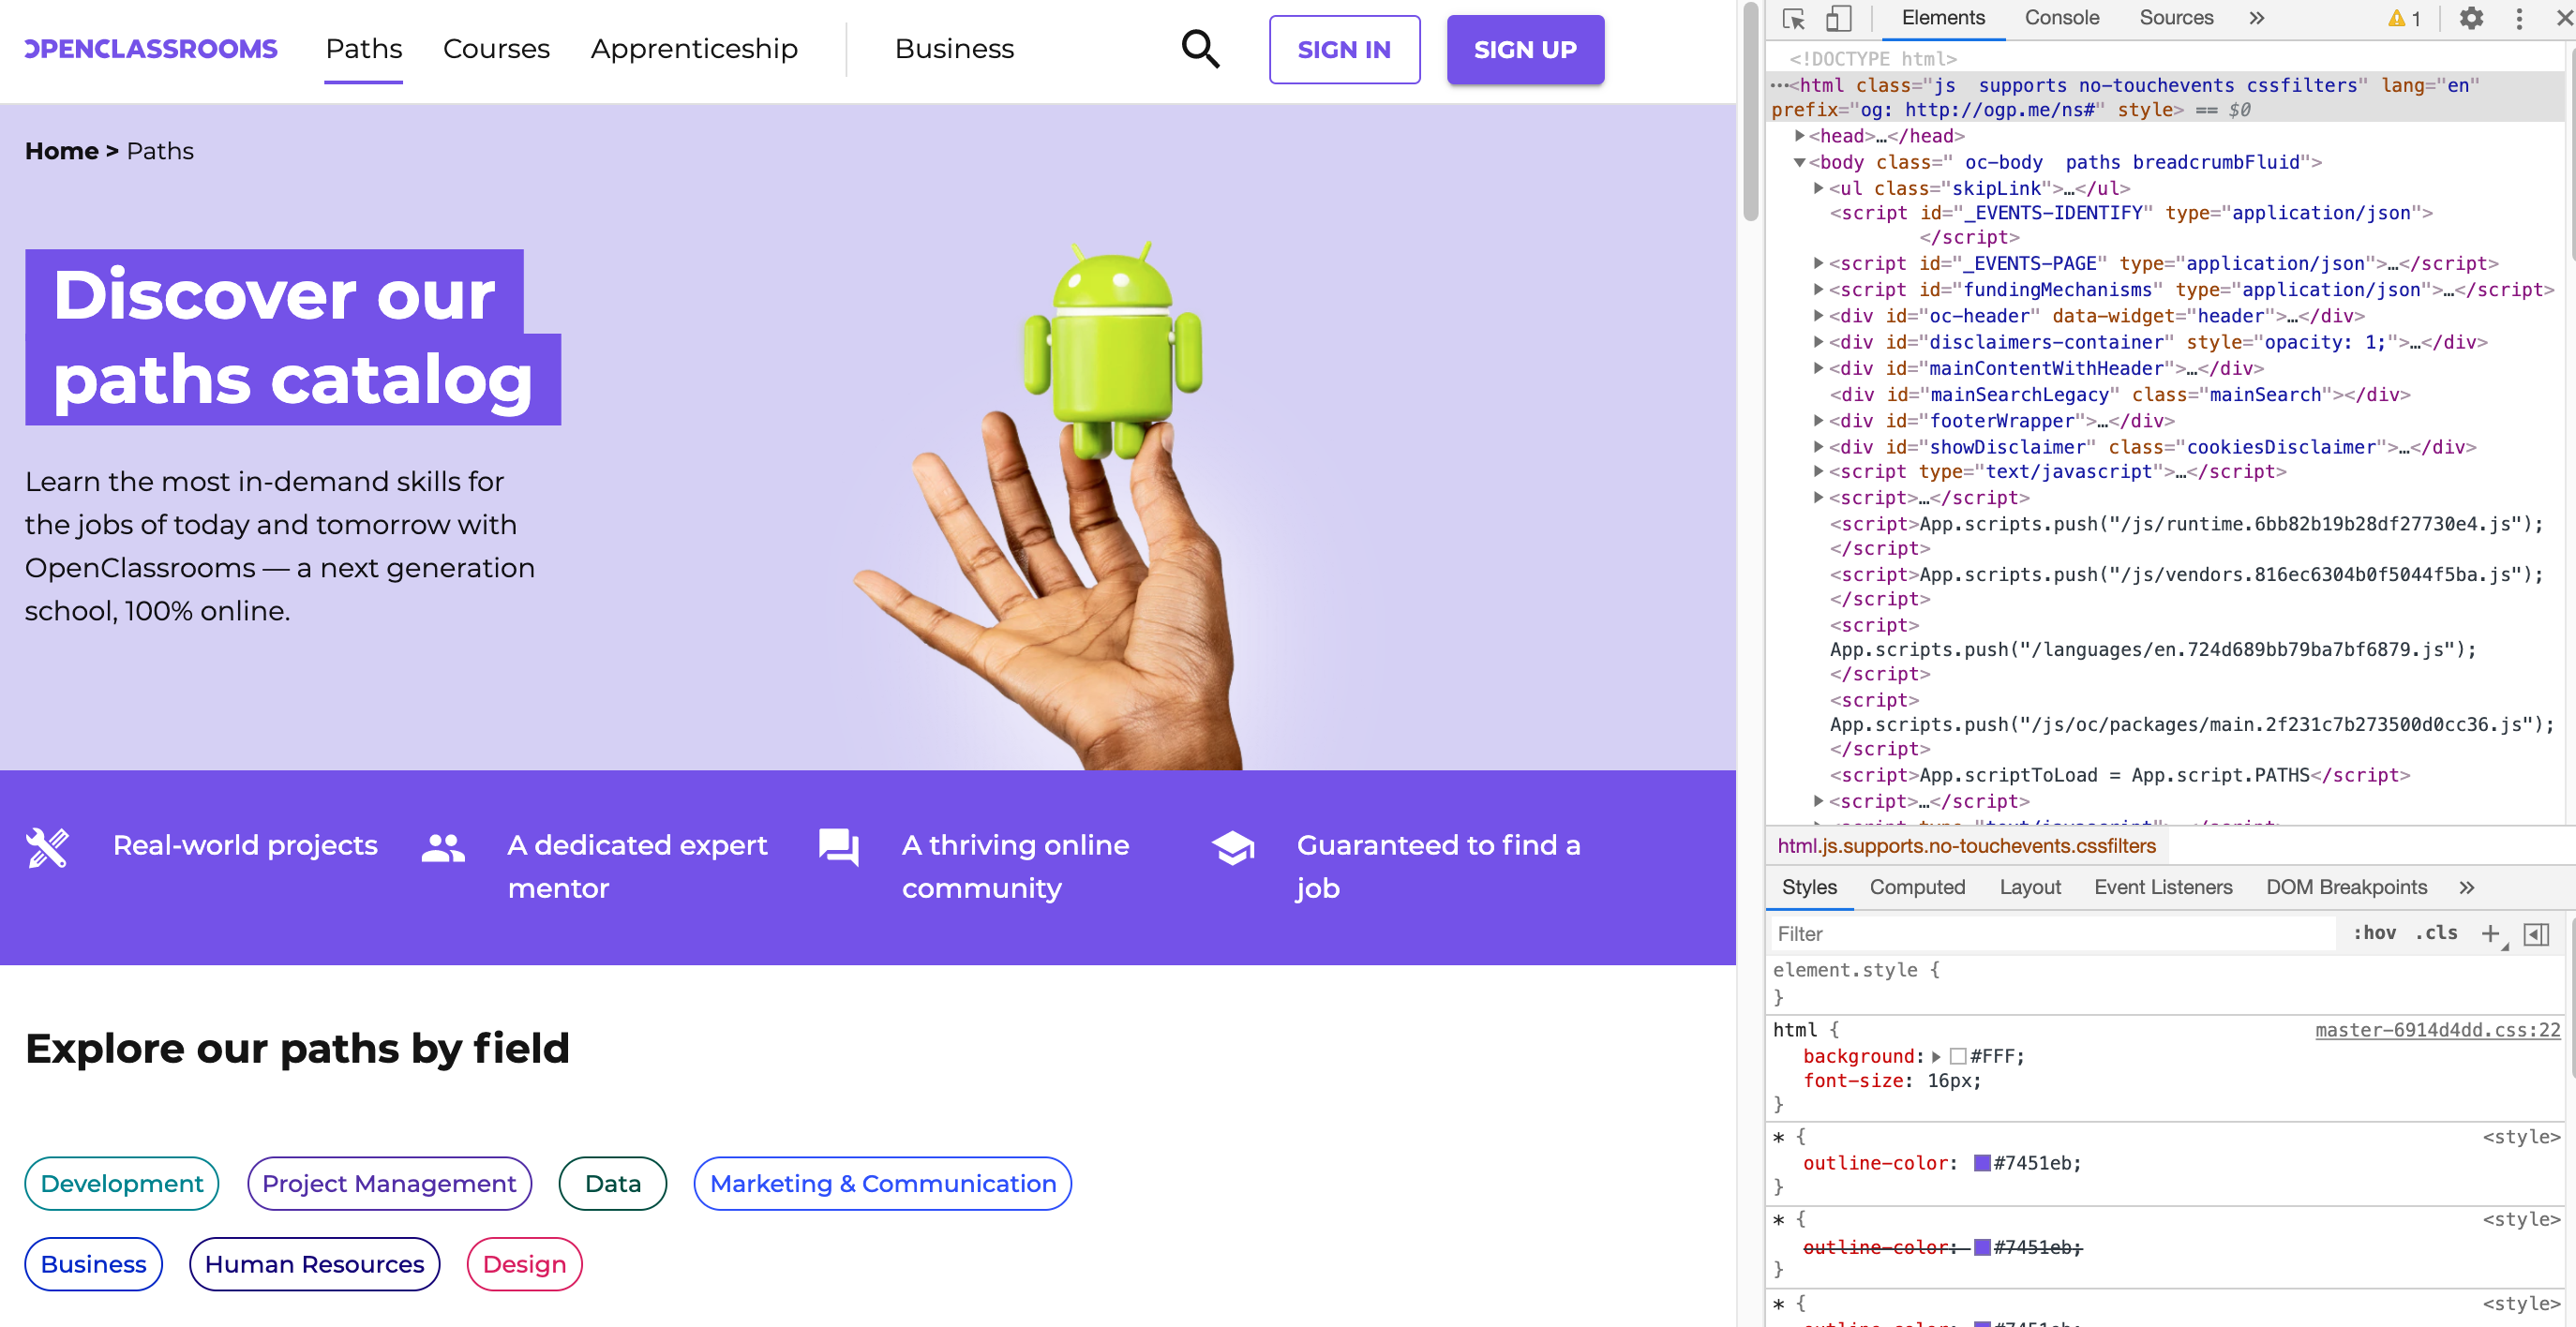
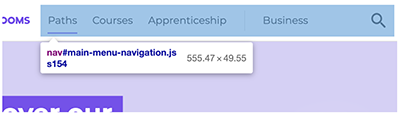
This highlighting tells you that the line you're hovering over corresponds to the page header. Let's dive further into the structure of the header by clicking on the arrow next to the line:
You'll notice that the div element contains a single child: a header element. The structure of this page is such that there are multiple single-child elements. In the screenshot below, I opened them all until I found one with the multiple child elements that you see in the header:
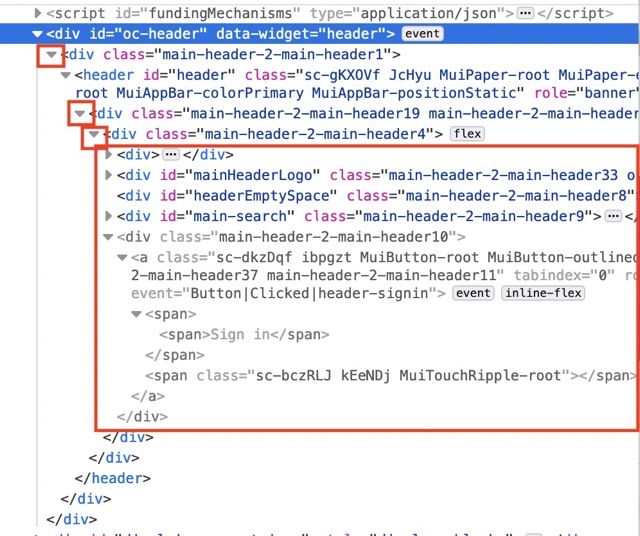
If you hover over the various children here, you'll see elements highlight on the page, letting you know which line of code is responsible for which visual element:
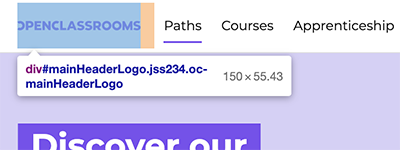
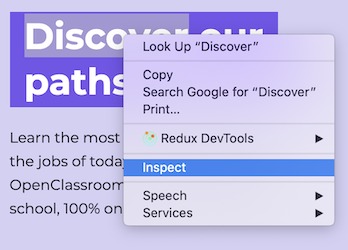
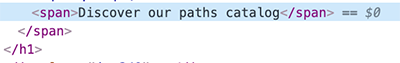
You can also find the line responsible for an element by right-clicking that element, then clicking Inspect. Try it out on the text that says "Discover our paths catalog:"
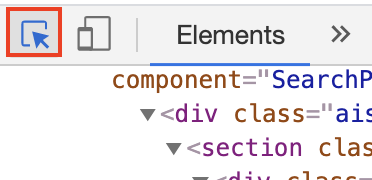
You can also activate inspection on selection, which allows you to hover and click on page elements to inspect them:
Explore the Inspector - Styles
Now find out what the style inspector looks like on your web browser:
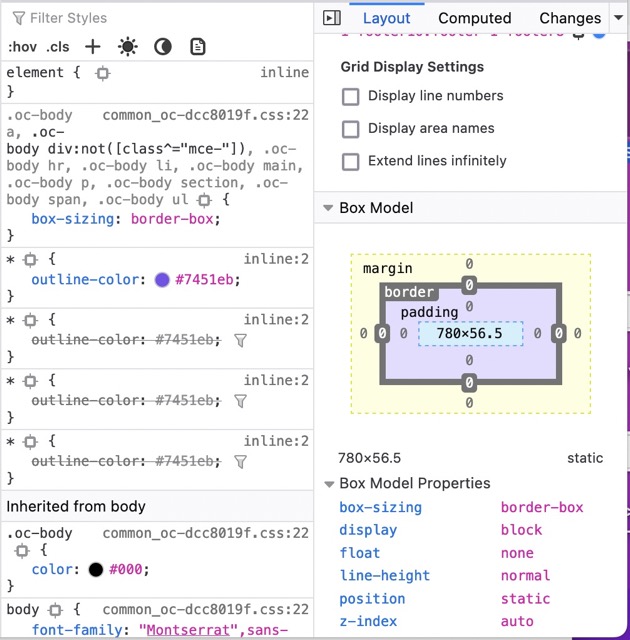
You can also use browser inspectors to view and modify the code responsible for a page's styles, which define the appearance of its elements. If you have changed your selection since the previous section, reselect the "Discover our paths catalog" text element. In the lower half of the Inspector, you should see the Styles section:
On Chrome
On Firefox
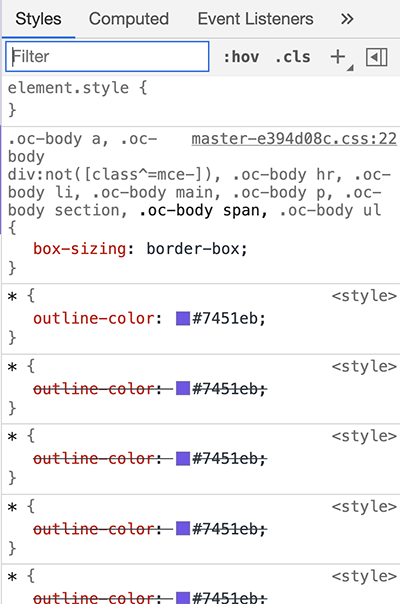
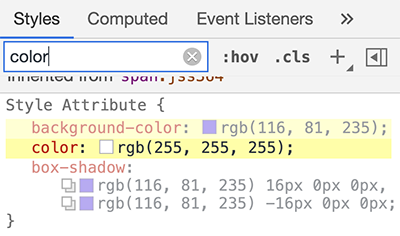
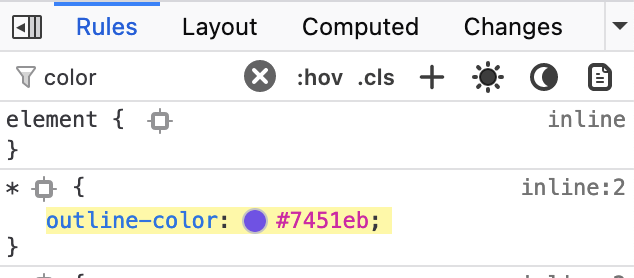
In the Styles inspector ("Styles" in Chrome, "Rules" in Firefox), you can filter the various styles to find exactly what you want to modify.
Let's say you want to change the white color of the selected text. In the filter field, type "color," and look for the color rule, which contains a small white square and the value rgb(255, 255, 255) :
On Chrome
On Firefox
Clicking on the value for color allows you to modify it. Try typing red , and watch the element change in the main window:

Study the Console
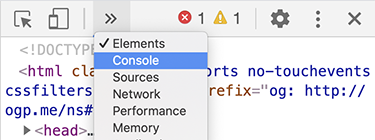
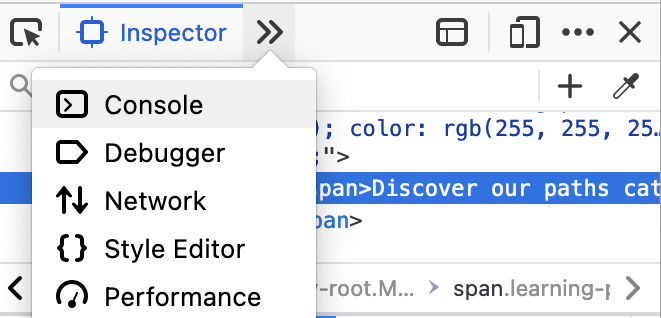
One of the other DevTools you will use very often is the Console. The Console provides you with vital information about how your projects run, especially if they encounter a problem. You can access the Console from the DevTools header:
On Chrome
On Firefox
As a front-end developer, you can make messages appear in the Console. For example, the developers at OpenClassrooms show a message warning users about the dangers of Self-XSS attacks. The attacker convinces the victim to paste malicious code into the Console.
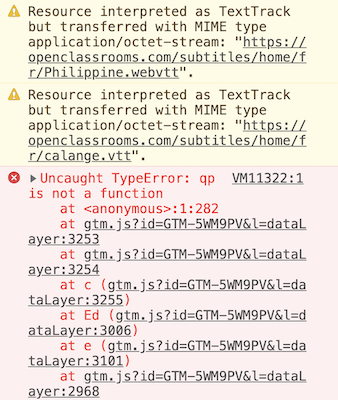
There are warnings linked to the source code at the time of writing - and an error!
Activate Mobile Mode

Roughly half of all web traffic today is on mobile, so as a front-end developer, you will need to test your project's appearance on several different devices. Find out how to handle the mobile design:
The DevTools let you simulate several types of mobile devices. You can activate mobile mode from the DevTools header:
On Chrome

On Firefox

After activating mobile mode, the active part of the browser window changes shape, allowing you to see the great job the OpenClassrooms developers have done! Their design works correctly in mobile view:

In mobile mode, the browser toolbar lets you choose the type of mobile you are simulating, its orientation, and you can even limit bandwidth to simulate a bad mobile connection!

Let's Recap!
In this chapter:
You analyzed web page structure with the inspector.
You found and modified an element's style.
You discovered the Console.
You used mobile mode to simulate browsing with a mobile device.
Congratulations!
Now you're ready to assess what you've learned with the quiz I've prepared for you!
