Analyze What’s Happening on Your PC

In this part, we’ll go deeper into Windows 10 and take on the role of an administrator.
In this chapter, we’ll start by analyzing your computer’s performance to check for any malfunctions. Let’s take a look.
Analyze Your Computer’s Performance
Throughout your career, you’ll often need to check what state a computer or server is in. And I don’t mean its physical state, but what’s going on inside. You can compare your computer’s state to your own:
Are you worn out?
Are you doing too many things at once?
Is there a problem stopping you from working?
It’s the same for your computer. It might be lacking resources, be doing too many things at once, or have a problem, which is stopping it from working. Performance analysis is all about identifying these potential problems.
Use the Task Manager
Processes
Windows 10 provides simple solutions for analyzing your PC. The first of these is the Task Manager. There are several ways of opening it: you can search for it with Cortana or right-click on the taskbar and select “Task Manager”.
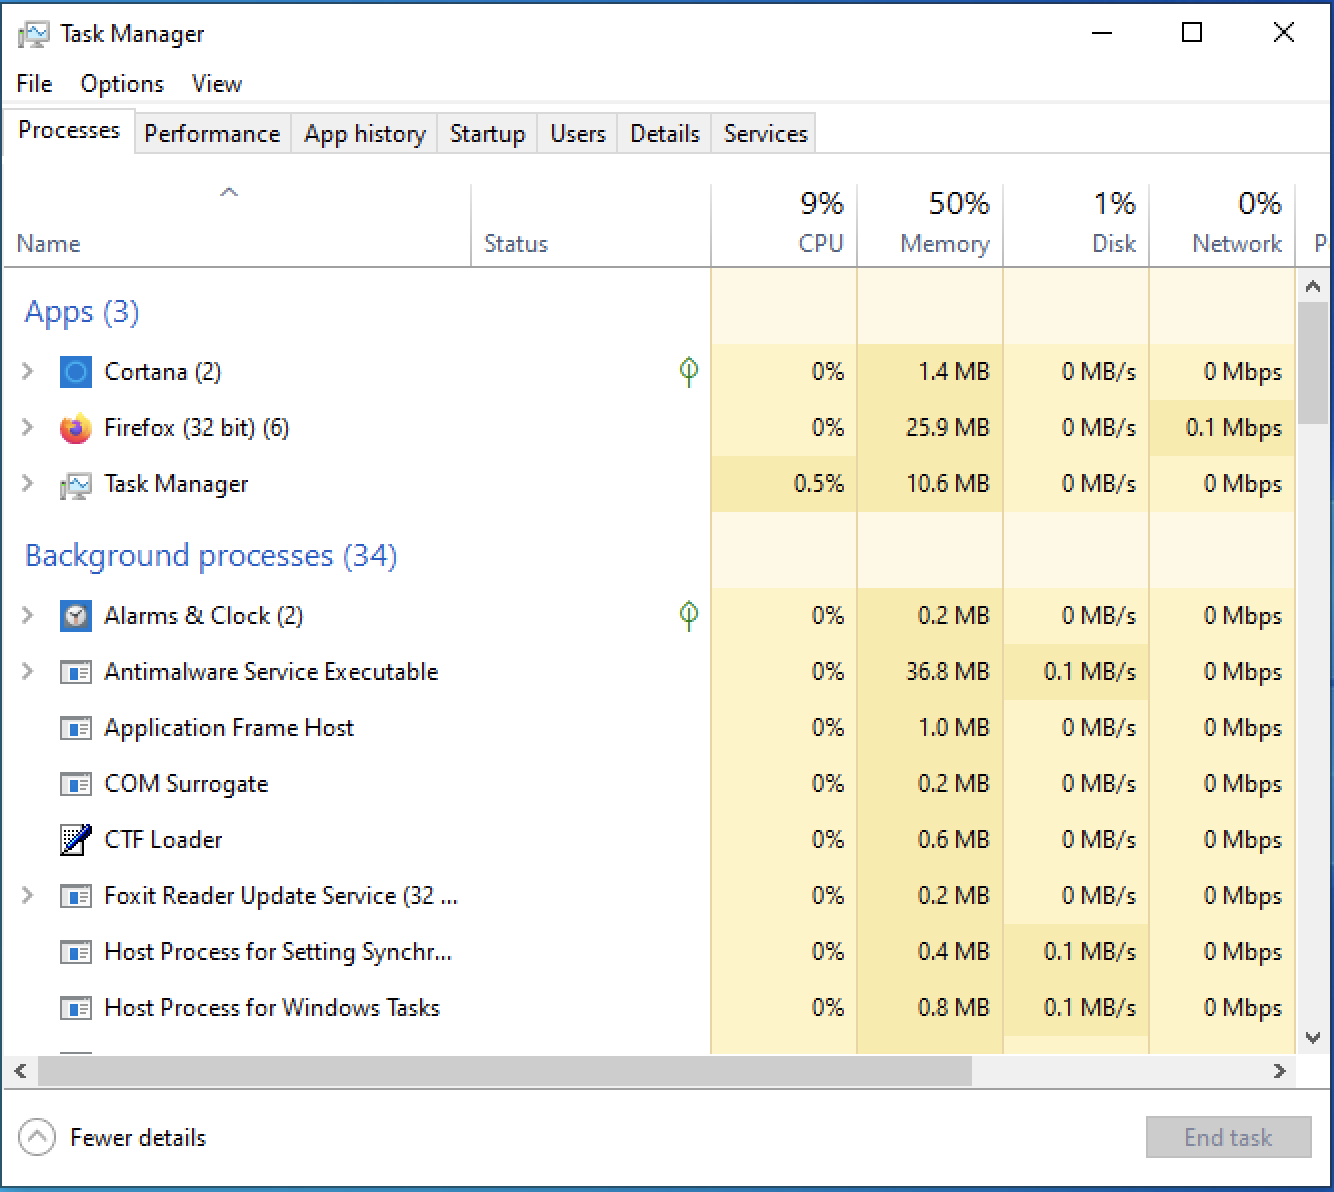
The first tab shows you the status of processes, or in other words, the apps you have launched on your computer and other programs launched as part of Windows 10. These tabs show the utilization of the processor (CPU), RAM, hard drive, network card, and graphics card (GPU), all in percentages.
In my case, you can see that 50% of my RAM is being used. If you click on “memory”, it will show the apps used in order of how much memory they are using. On my computer, the app using the most RAM memory is my web browser, Firefox.
The first thing to do when a computer is running too slowly is to check that no app or program is using up too many resources.
If this is the case, the app in question probably has a problem. You can “kill” the app by selecting “End task” in the bottom right-hand corner. A word of warning though, make sure you only use this feature on apps and not any background processes. Another explanation could be that the computer does not have enough resources for the app. In this case, the only solution is to update your hardware. You can look at adding more RAM or buying a new computer or server.
Types of resources
The second feature of the task manager, the “Performance” tab, gives you more detail on the status of a resource, without taking specific apps into account.
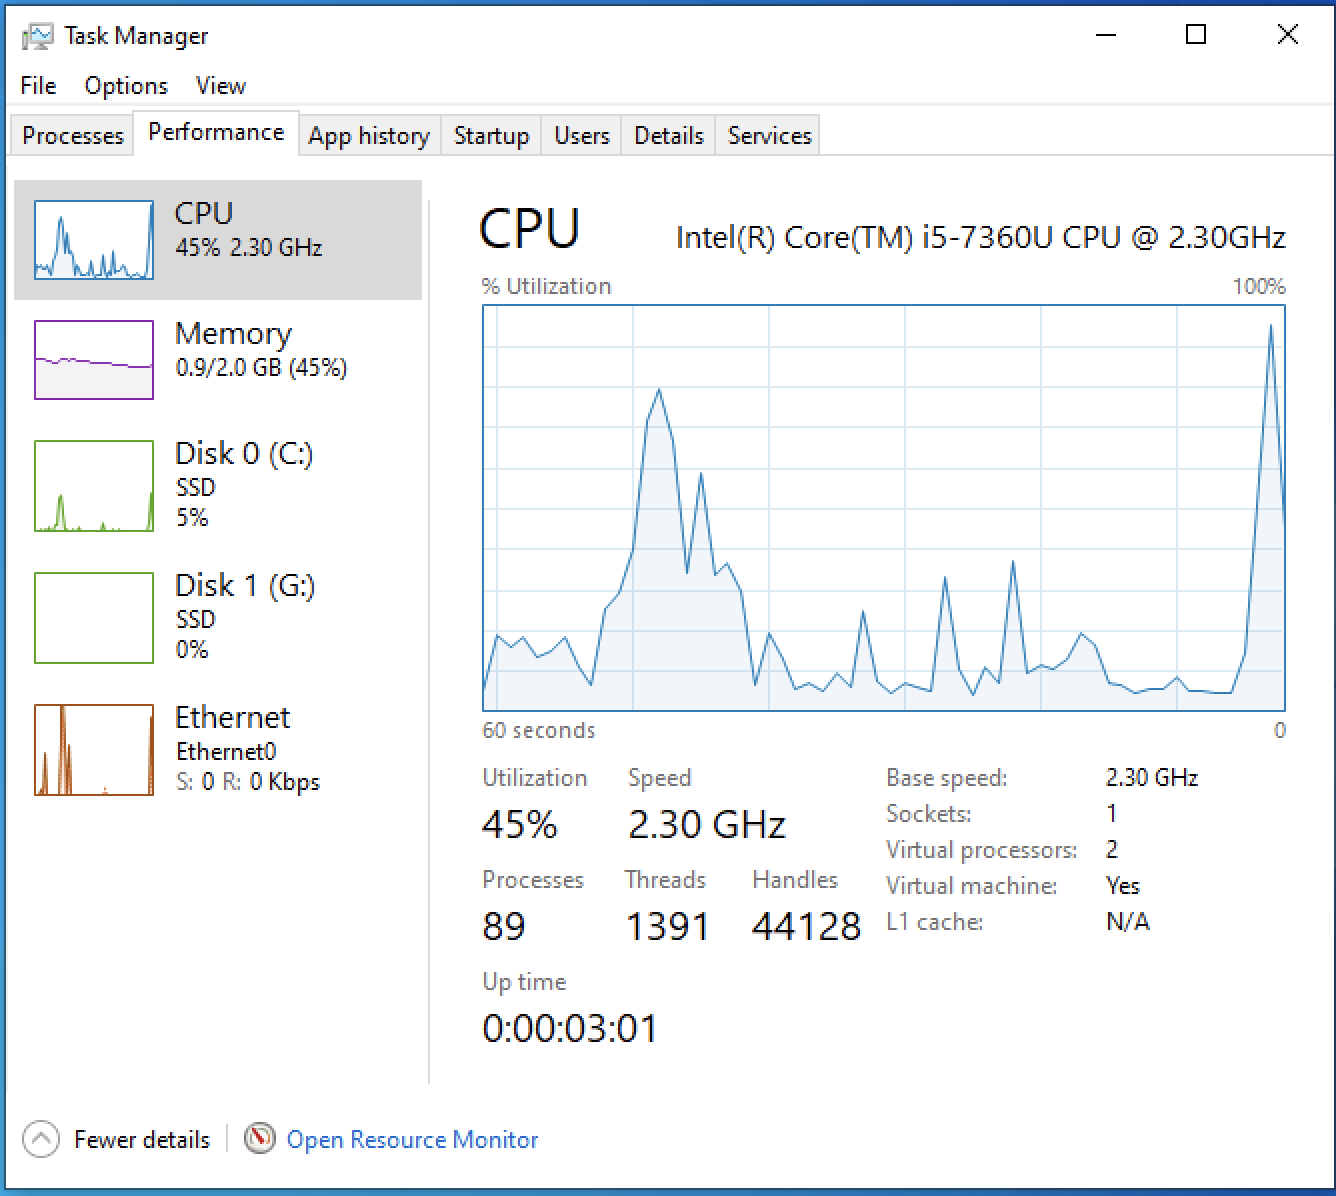
As well as the utilization percentage, you can also see CPU speed – in other words, how many operations your processor carries out every second. In my case at this particular instant, my processor was carrying out 2,300,000,000 operations every second.
As well as CPU, you can check the utilization of RAM, hard drive(s), and network cards.
Take a look at the video below for a complete run-through on how I use Task Manager to manage my computer:
Performance Monitor
If this analysis is not precise or detailed enough, you can use Performance Monitor. To open, either type “Performance Monitor” into the search bar, or open the start menu, scroll down to Administrative Tools, and select Performance Monitor.
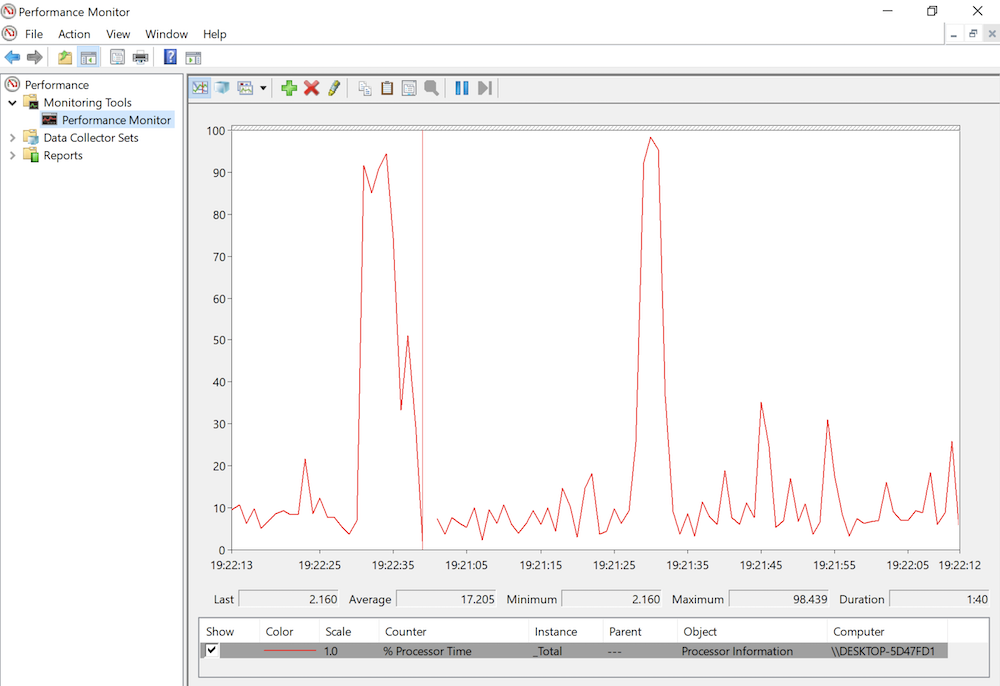
The Performance Monitor is useful because it allows you to be more detailed in your search. For example, if we take the processor, there are dozens of indicators available. You can view idle time, metric averages, and other metrics which help you monitor your PC. We’ll cover this further in the next chapter.
To add an indicator to your Performance Monitor, simply:
Click on the + button (in green).
Select a counter (in other words, a type: processor, processes, RAM, etc.).
Select one instance or several.
Take a look at the video below to see how I monitor my computer’s performance using the Performance Monitor:
Let’s now look at how to test an app that isn’t working properly.
Use Selective Startup
If one of your apps is not working properly, your company’s business app, for example, it might not be the app itself causing the problem but something else part of the configuration of Windows. In other words, anything installed on the computer and its associated settings.
To find out if it’s your app that is causing the malfunction, you can restart Windows in “selective mode”. Using this mode, you can restart Windows with only the basic services selected and rule out those which may be causing problems.
To do this, go to Administrative Tools and click on “System Configuration”.
In the “Services” tab:
Check the “Hide all Windows services” box.
Click “Disable all”.
Restart Windows.
If your computer works properly when you restart Windows, you’ll know that the problem is linked to your configuration. The next step is to identify any changes you’ve made on your computer which may be preventing your app from working properly.
Now let’s find out how to test your PC’s memory.
Windows Memory Diagnostic
My computer often crashes and a blue screen appears. What’s the problem?
This could be due to a problem with the RAM module. This component is frequently used and as a result, can malfunction. Because of this Windows has a diagnostic tool that carries out a number of tests on your installed RAM.
To open “Windows Memory Diagnostic”, go to "Administrative Tools" and click on “Windows Memory Diagnostic”.
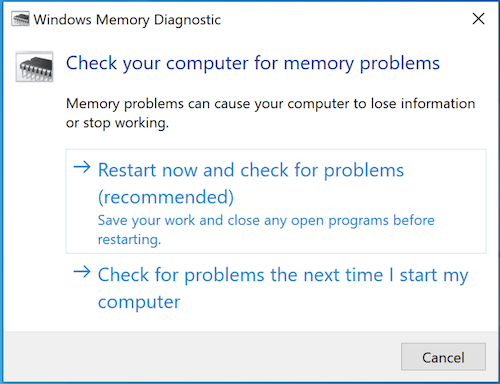
You’ll be given two choices: restart now to check for problems or check for problems the next time I start my computer.
When the computer restarts, the test will be carried out automatically:
Press the F1 key to carry out an advanced test.
Choose the extended test mix (this means that all test types will be carried out – the others include fewer tests and are quicker).
Select “cache: on” (this is the memory built into your CPU).
Finally, choose five for the number of passes (the rarer the fault is, the more difficult it is to find, so if you run several passes you have more chance of finding the fault).
Your Turn!

🎯 Today's mission at CleanFuture: One of your CleanFuture colleagues has had performance issues with his PC since their very first day.
The computer takes a very long time to turn on each morning, applications such as Microsoft Edge are running slowly, and he regularly receives warnings on screen about the computer running out of RAM. Because of this, he is finding it difficult to carry out his daily tasks.
You have agreed to spend two hours this week analyzing the computer and work out what the issue is.
Before spending time on your colleague’s troublesome computer, you decide to run through the same steps that you plan to take, on your own PC.
⚙️ The actions you need to take: Use the following tools to analyze how your computer is performing:
Task Manager
Performance Monitor
Selective Startup
Windows Memory Diagnostic Tool
✅ Double-check your work: You’ll know you have completed the exercise when you have used Task Manager, Performance Monitor, Selective Startup, and Windows Memory Diagnostic Tool to monitor your computer’s performance
Let's Recap!
Analyzing your computer means understanding how it is functioning – i.e., does it have enough resources to do what is being asked of it? Is it encountering problems?
To carry out this analysis, Windows 10 has several tools:
Task Manager, which allows you to quickly check what resources are being used.
Performance Monitor, which allows you to analyze the computer’s resources and processes (applications) in more detail.
Selective startup, which allows you to start Windows with a basic configuration – i.e., without the changes you’ve made to it over time. This will show you if the fault lies with an app or with Windows, by temporarily disabling all other services on the operating system.
The Memory Diagnostic tool, which allows you to detect RAM problems, including in the CPU cache.
We have completed a lot of work in this chapter! You now understand Task Manager, Performance Monitor, and other in-built tools are available to you as an administrator to analyze your computer’s performance when a fault is detected. In the next chapter, we will use these tools to monitor your computer to pre-empt any faults before they arise.
