Table of contents
- Part 1
Course Orientation
- Part 2
Take Your First Steps With Windows 10
- Part 3
Become an Administrator in Windows 10
- Part 4
Protect Your Windows 10 Operating System
Table of contents
- Part 1
Course Orientation
- Part 2
Take Your First Steps With Windows 10
- Part 3
Become an Administrator in Windows 10
- Part 4
Protect Your Windows 10 Operating System
Monitor Your PC

In this chapter, we’ll discover how to monitor your computer. Rather than only checking your computer when a fault is detected, you can regularly monitor the use of resources such as the hard drive, RAM, and the processor. You’ll learn how to produce frequent reports on these different utilizations. The aim of monitoring your computer is to prevent its resources from becoming overloaded.
Create Reports
In the previous chapter, you saw how to measure resource utilization at a given moment using the Performance Monitor. Now we are no longer interested in obtaining a snapshot of a certain moment, but in creating a report over a longer period. Let’s start by opening the Performance Monitor and taking a look at it.
Create a data collector set
Open Performance Monitor again. On the left-hand side, click on “Data Collector Sets” and then on “User Defined”.
In the space to the right of the tab:
Right-click > "New > Data Collector Set".
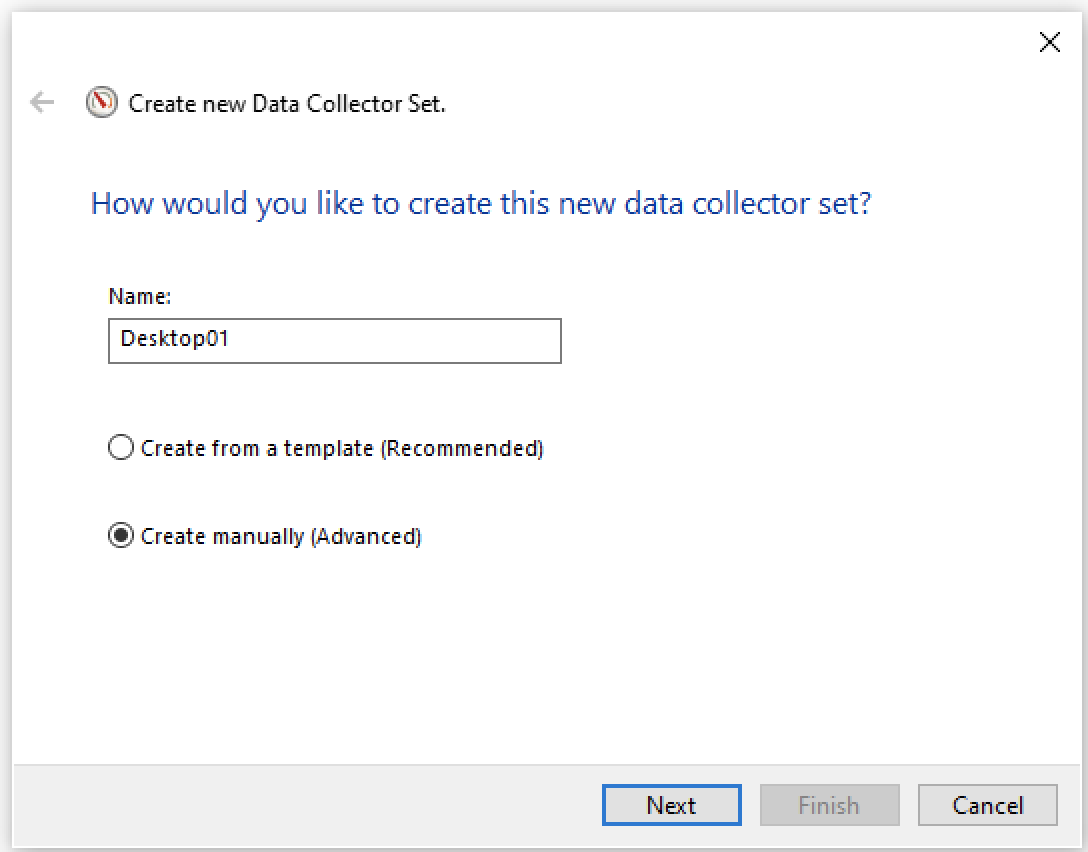
Give your data collector set a name, select “Create manually (Advanced)”, then click “Next”.

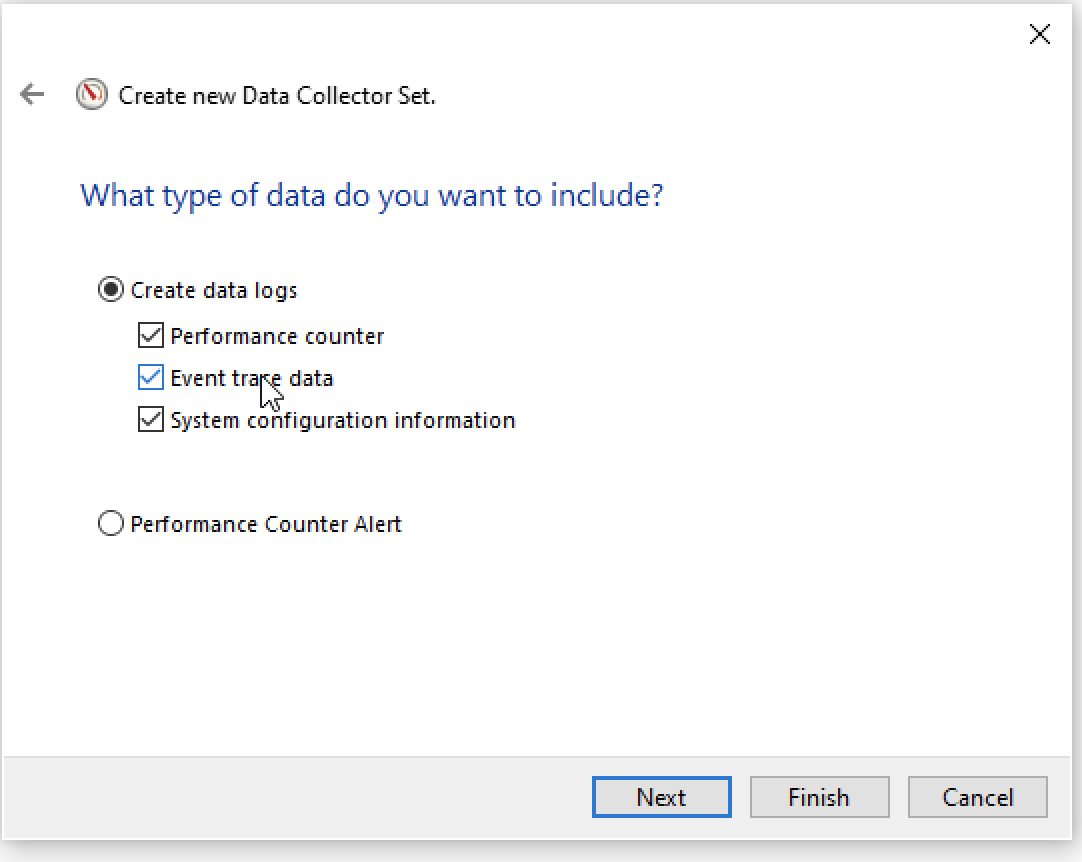
Select create data logs and check all of the options below it, and then Next.

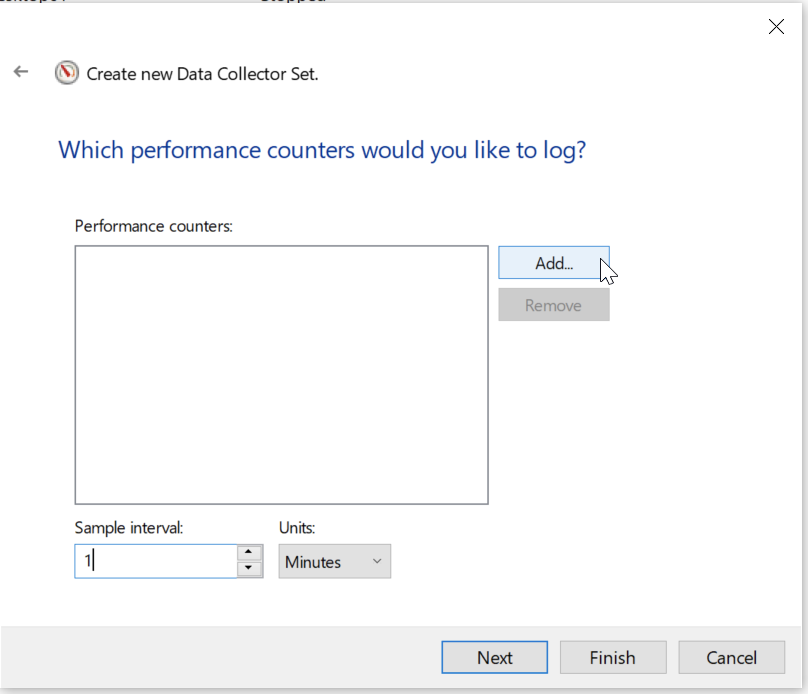
Set the sample interval to one minute and click Add.


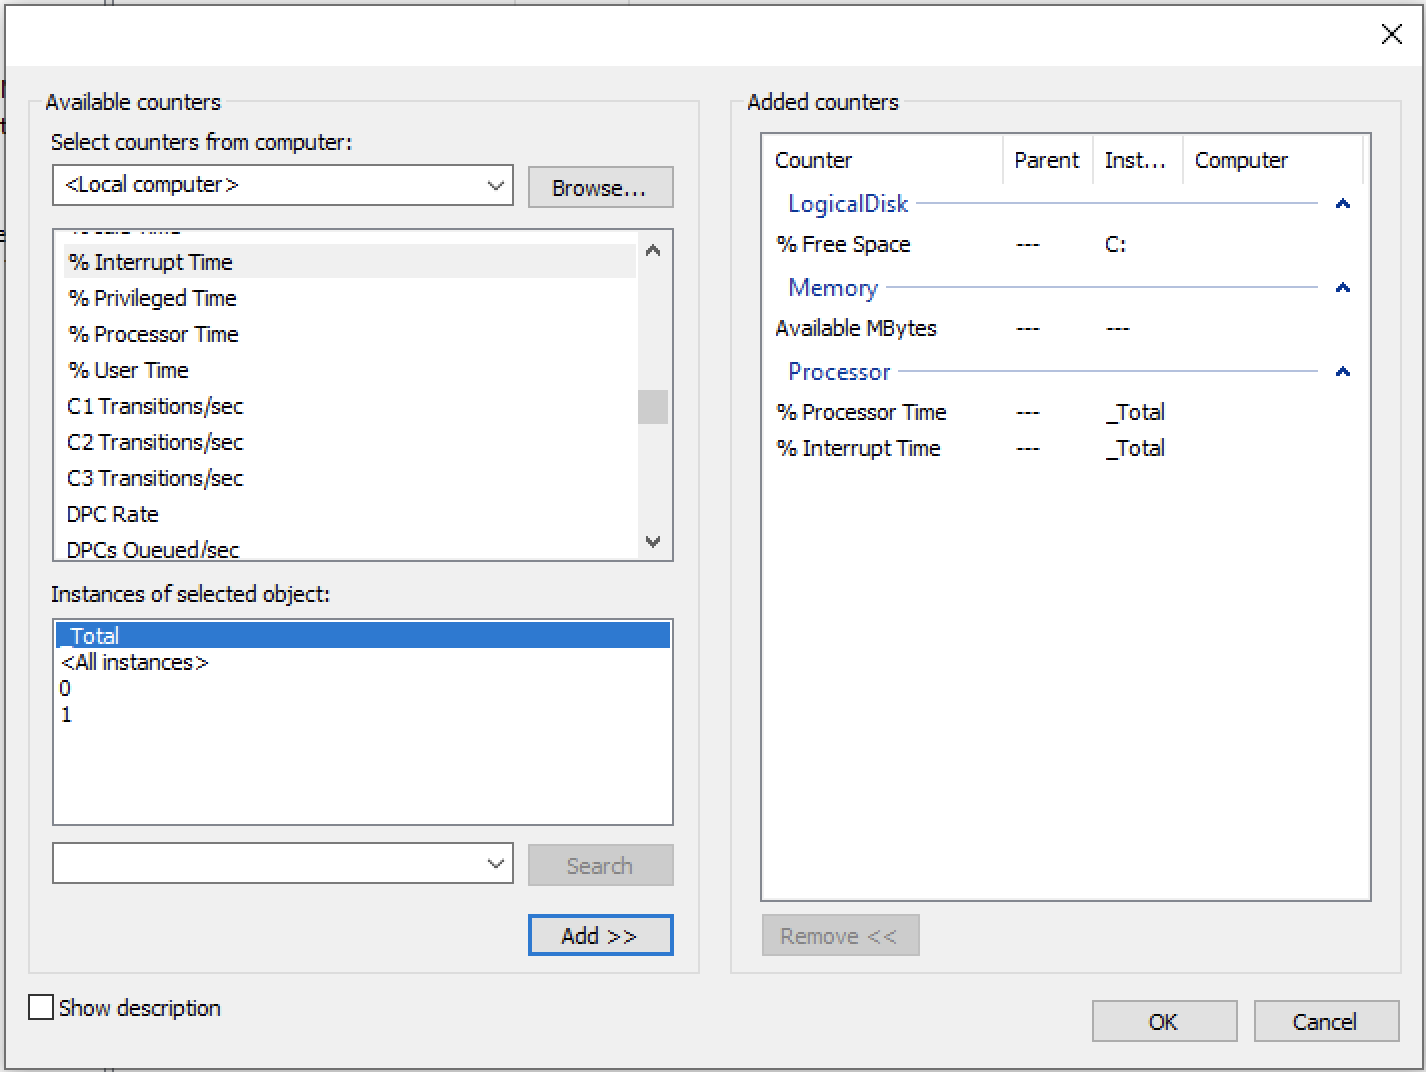
On the left, you can select the different counters. I recommend selecting the following:
“LogicalDisk”: % Free Space
“Memory”: Available MBytes
“Processor”: % Processor time, % Idle Time
“Process”: % Processor Time (here you can choose specific applications processor statistics to check, such as your company’s business app)
Click “Next”, “Finish” – and there you have it, you’ve configured your data collector! Follow along with the video below to see how I create a Data Collector Set:
Next, we’ll go through launching your first report.
Launch a report
In the left-hand tab, right-click on the collector you’ve created then click “Start”.
In the “Reports” section in the left-hand tab, you can see the collector you’ve created. You can access it by clicking on it.
You’ve now seen how to monitor your PC in Windows 10. There are many other ways of carrying out monitoring in a company, with free services such as Nagios or alternative paid services which will need to be configured to your requirements.
Your Turn!

🎯 Today's mission at CleanFuture: CleanFuture is going to be using a new accounting application.
Your manager wants to make sure the Windows 10 computer assigned to run the application has enough resources to run without freezing. She has asked you to generate a report to verify this before the application is installed
⚙️ The actions you need to take:
Create a Performance Monitor report displaying the free space on the logical disk and available RAM.
Run the data collector using an interval of one minute.
✅ Double-check your work: You’ll know you have completed the exercise when your Data Collector Set is saved in Performance Monitor with the correct metrics.
Let's Recap!
You can monitor the status of a computer or a server.
Windows 10 includes tools to create reports for monitoring.
To create a report:
Launch the Performance Monitor
In the left-hand tab, click on “Data Collector Set”
Select “User Defined”
In the space on the right, right-click > New > Data Collector Set
Name it and select “create manually (advanced)”
Choose a sample interval between 30 seconds and one minute. Select the relevant counters for your monitoring (in general, as a minimum, check the free space on the hard drive, RAM utilization, processor utilization, and in certain cases processes that may represent a risk).
Great work! You should now have a good understanding of how to create customized reports to monitor the health of your computers and servers - a great way to discover any issues before they arise. We’ll now move on to optimizing your computer’s performance by using Disk Manager and Task Scheduler, applications that are part of Windows 10.
Ever considered an OpenClassrooms diploma?
- Up to 100% of your training program funded
- Flexible start date
- Career-focused projects
- Individual mentoring
Find the training program and funding option that suits you best
