Help Other Stakeholders Make Decisions

Report Evidence From Tickets
Managers and other service desk stakeholders will want to see some output from the gathered data. Such outputs can help identify opportunities for improvement, either knowledge-based or technical, such as identifying troublesome hardware brands or models. Reports can also identify busy and quiet periods to help with resourcing, so-called capacity planning.
Earlier, we activated the Explore reporting tool, and it should be ready for use now. The tool itself is feature-rich and worth exploring. As an introduction, though, we’ll create a very simple report:
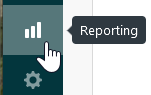
Select Reporting from the left panel.
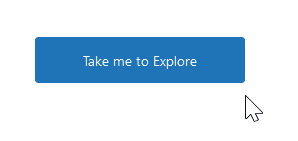
If Explore has finished setting up, the button at the bottom of the screen will have changed! Time to press it:
Let’s make a very quick report using the Support dataset:
Click Get started if you are presented with a welcome page.
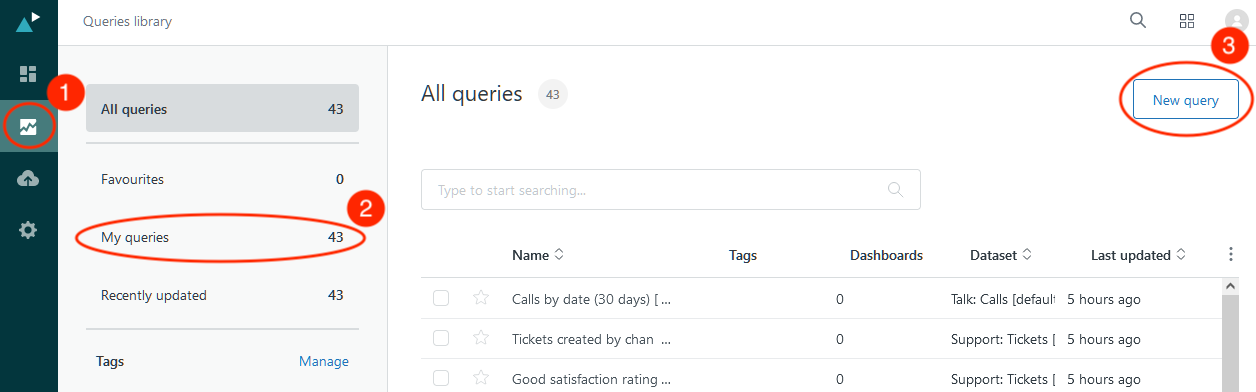
Select the Queries icon from the left panel.

Select My queries from the Queries library on the left
Then select New query on the top right corner.
Choose the Zendesk Support dataset.
Choose the dataset type Tickets.
Choose Support: Tickets[default].
Finally, click New query.
![Queries properties from the top: Choose a Zendesk Product-Support is circled; Choose a dataset type-Tickets is circled; Choose a dataset, name-Support: Tickets[default] is selected and circled. At the bottom of the image the button New query is circled.](https://user.oc-static.com/upload/2022/03/09/1646787837222_image52.png)
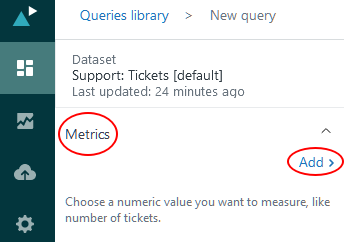
On the dashboard select Metrics from the left menu column, then click Add.
Select Ticket, and choose COUNT.
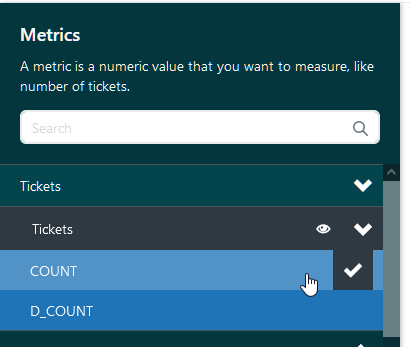
Click Apply.
Next:
Select Column, then click Add.
Select Ticket, and choose Ticket tags.
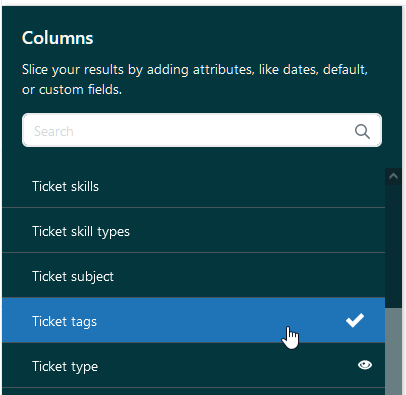
Click Apply.
Next:
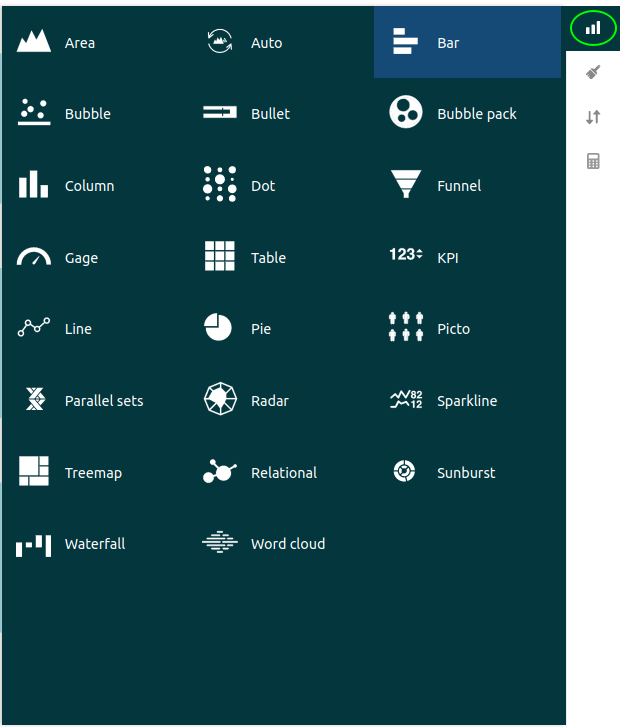
Select the Visualization type menu (top right) to select a different report format, for example, a bar chart.
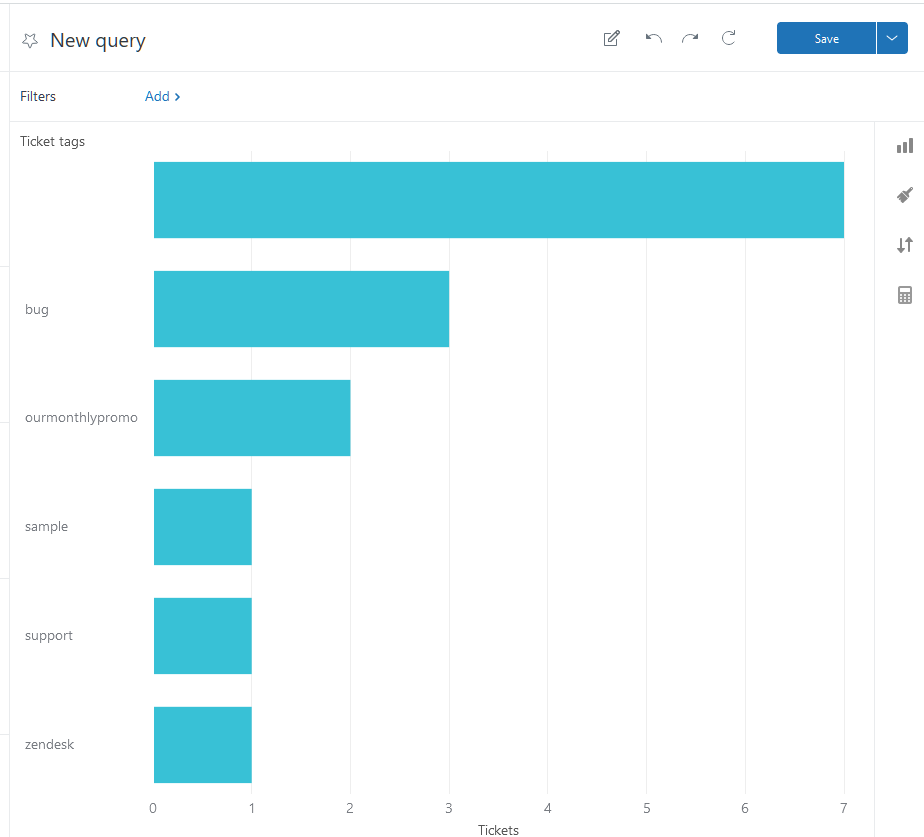
Great! You have a summary of tickets by tag that should look like something similar to the image below. Your report may differ depending on the state of your tags and which visualization you choose.
Give your query a name by overwriting ‘New query’ at the top.
Click Save (top right) to save your great report template.

Notice the popup. Why not add the report to your dashboard! If the popup disappears before you get to it, just click the down arrow next to Save, and you’ll find Add to Dashboard there too.
Since you don’t have a reporting dashboard yet, you will be prompted to create a new one - confirm that, then save your work!
Click the Zendesk icon top right:

Behold! Your new reporting dashboard is ready to select!
Notice at the top that your dashboard is only a preview and not fully live:

To make your dashboard fully live:
Select the Dashboard icon from the left menu strip.
Locate the line for your newly created dashboard (probably the top one).
Click the Edit option on the right side.
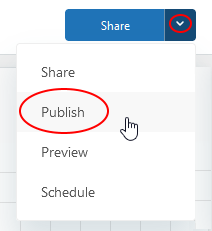
Click the dropdown menu next to the Share button and select Publish.
And there you go, you have created a dashboard to keep track of your reports!
Let’s get back to Zendesk Support (the Agent workspace screen).
As well as reporting on ticket volumes and grouping them by common themes, such as hardware or software, other reports may be produced about the support team itself. The theme “Daily calls handled” might be relevant in a call center that deals with very similar tickets all the time and can help spot where people are overloaded, or, conversely, whether they seem to be taking life too easy!
However, when the nature of the tickets becomes more diverse, and people with specialist knowledge need to get involved, “handled call volume” becomes less useful. A person may suddenly get assigned a tricky incident that takes many hours or days to handle, hence undermining the accuracy and interpretation of the reports.
For example, if one person is taking longer than others to handle a particular type of ticket this might indicate that they have a knowledge gap and would benefit from some on-the-job training - say, for example, shadowing a colleague while they handle relevant calls.
Well, that was a whistle-stop tour of some of the basic Zendesk operations, and it should have given you a good taste of IT service management operations performed in an ITIL-like way.
But wait, we have an open Problem ticket! It would be unfair to wrap up this course without resolving it, so fast forward a bit and there’s good news because our developers looked at the situation, did some root cause analysis, which identified a few things:
A few of the customer data entry fields were not set up correctly, resulting in them not handling spaces and some non-alphanumeric characters in the right way. That’s why Jordan O’Flynn was having problems - the apostrophe in their name was not handled properly!
A training gap meant that a developer and their peer reviewer (who had recently joined our team) were not totally up to speed with our testing practices, so a few programming quirks made it through to deployment.
The release testing process needed improvement to catch such coding errors.
All good!? Well, the relevant teams know what to do; there are some training and process changes to complete, plus some updates need pushing to the live servers. Good job, team!
Now it’s your turn. Head back into Zendesk, find your problem ticket, add some relevant notes about the root cause analysis and conclusions, then solve the ticket. Problem done!
Let’s Recap!
Ticket reports can help identify opportunities for both knowledge-based and technology-based improvements.
Reports can also help with capacity planning by identifying busy and quiet periods to help with resourcing.
Reporting on simple support requests volume becomes less useful when the nature of the tickets received becomes more diverse.
Reporting against support team members can help identify knowledge gaps that might be filled with training or shadowing colleagues.
Well done! We’ve made it to the end of our run through some of the fundamentals of ticket management with Zendesk, and have picked up some ITIL terminology and best practice along the way. Communication also plays a big part in delivering excellent customer service, so we’ve spent time looking at some of the basic rules to create a positive and consistent customer relationship.
That’s a good, all-around kick start into the world of IT customer service and will be of use whether you use Zendesk or one of the other many excellent ITSM products on the market.
There’s only one thing left to do, and that’s to check whether any of the knowledge from part 3 has found a home in your internal storage!
