Connect Tables for Cross-Tab Analysis

In the previous chapter, we corrected data in the family circumstances table. You can now use this data with your other tables to give you a more comprehensive overview of the customer file.
First of all, you need to understand the concept of connecting data tables.
Connect Your Data Tables
In the mortgage application table, you only have the numbers assigned to the customers who have made the applications.
How can we visualize the number of applications submitted by married customers that were approved by Global Bank?
As things stand, you’d have to:
Take the list of married customer IDs from the Family Circumstance table.
Search the mortgage application table for approved applications under these IDs.
A tedious job—the kind of thing that eats up hours of your time on Excel!
In the next video, I’ll use a specific example to show you why you have to connect your tables to perform these cross-tab analyses.
You’ll also see that Power BI creates connections between your tables automatically, and that you’ve already been using these without even knowing it!
Power BI has really helped so far by creating relationships automatically, like the one between the branch table and the mortgage application table.
Let’s now see how to create those relationships:
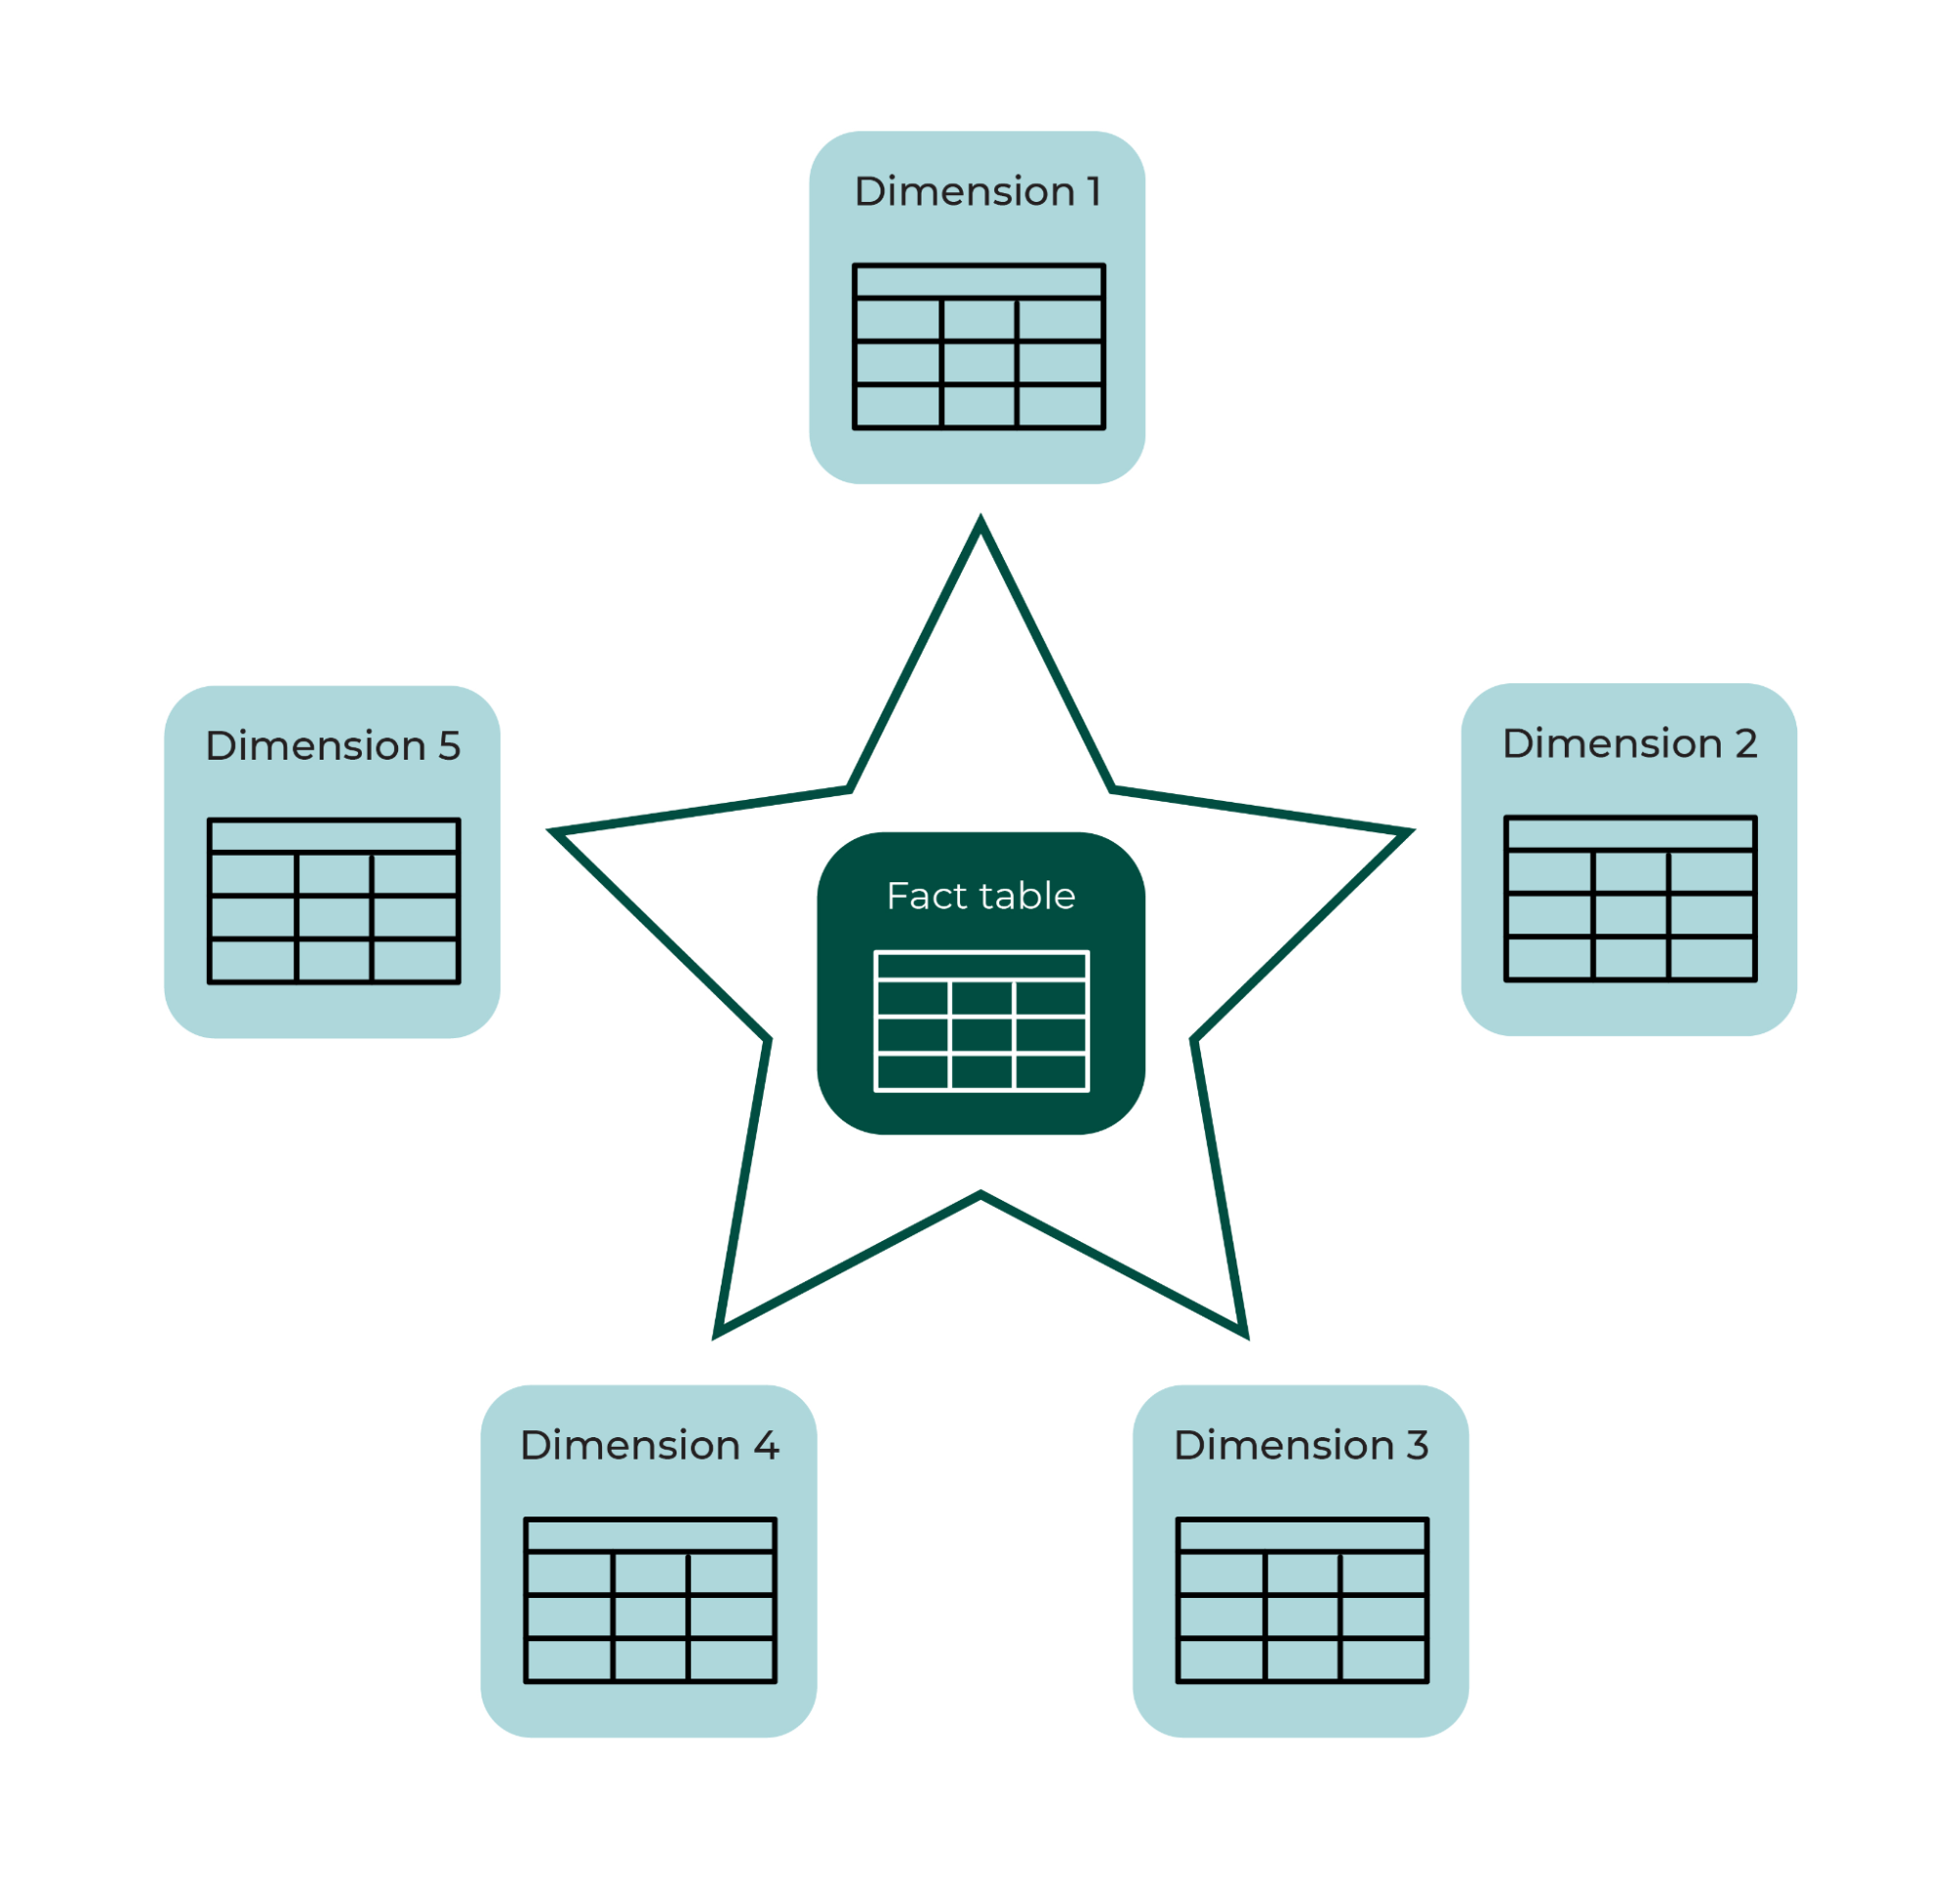
Understand the Star Schema
Data modeling is one of the most important concepts in Power BI, and in business intelligence in general!
As you’ve just seen, you can create complex models simply by adding additional tables. Considering the type of spreadsheets you’re probably used to working with, that’s a real revolution!
If you had the data, you could consider adding the following to your model:
How customers heard about you, to identify the most effective marketing channel.
Or even the branch advisor in charge of the mortgage application to calculate their performance in the company.
And so on. You get the idea!
Star schema design is really important for developing Power BI models and optimizing performance.
Bear in mind that each report visual that Power BI generates is a query sent to the Power BI model. These queries are used to filter, group, and summarize the data in the model. A well-designed model provides the tables for filtering and grouping, and tables for tabulation.
With the star schema, you also save storage space and simplify maintenance.
If the name of a Global Bank branch changes, you only have to change a single cell in your Branch table. If all of the data were in a single table, you would have to change all of the mortgage applications for the branch in question to reflect the name change.
Combine Queries Instead of Connecting Data Tables
A situation may arise where you need to combine tables into one rather than using relationships between data tables.
Here are two example scenarios:
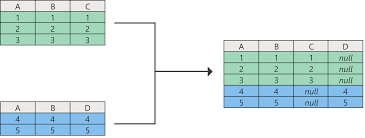
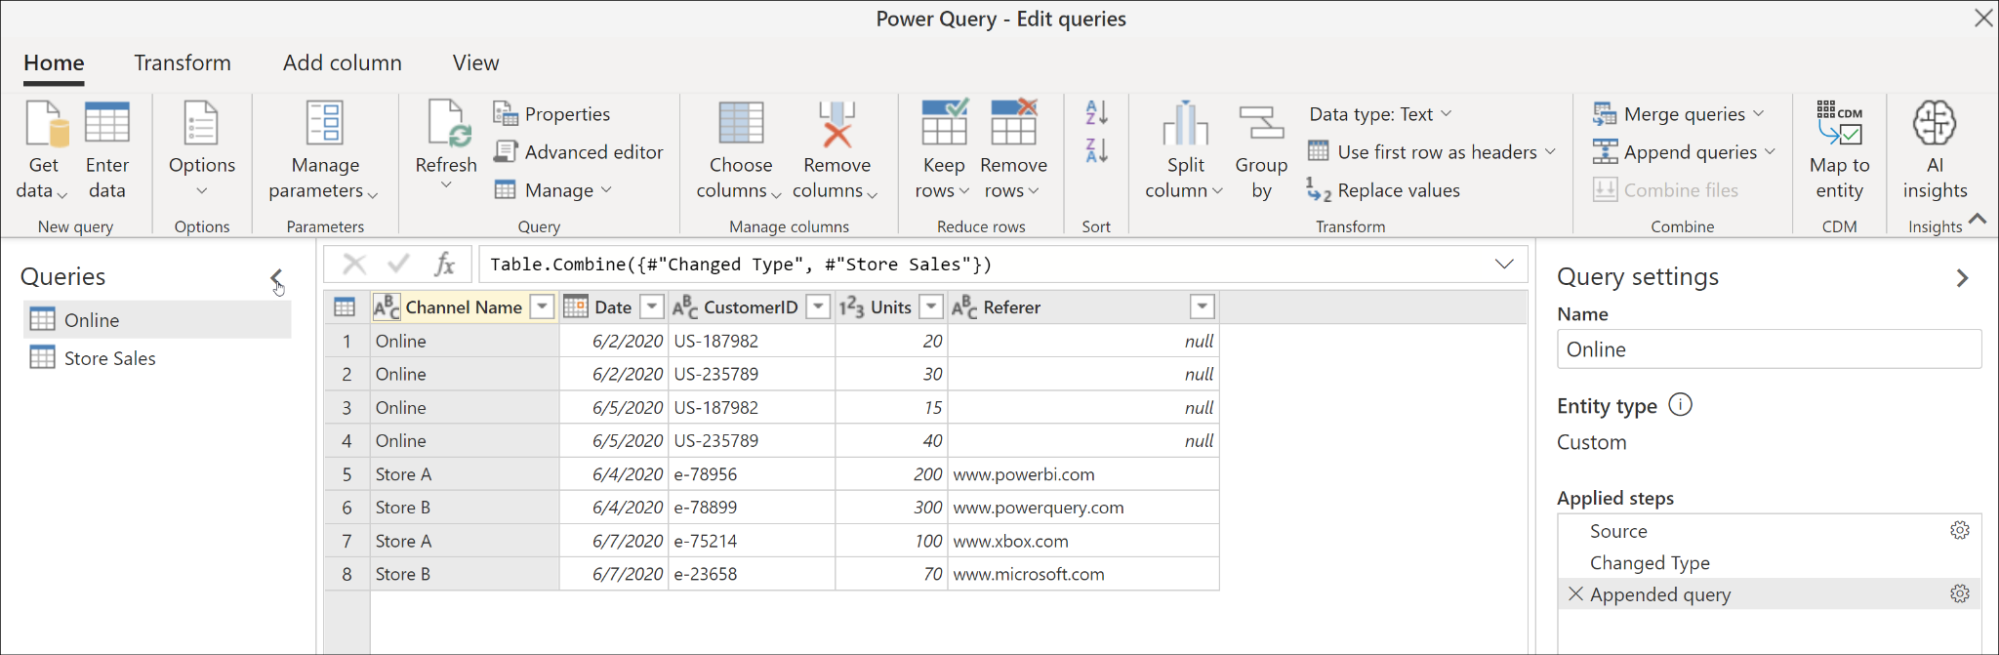
Scenario 1: You Have Several Event Tables
Imagine a table of mortgage applications by year (so four since 2017). In this case, it’s useful to be able to append events to your table to create one single complete list.
Scenario 2: You’re Lacking Dimensions on Your Event Table
In our case, for example, there is a Down Payment table that only contains the size of the down payment and the mortgage-application numbers. This has several drawbacks:
This table has as many lines as the mortgage-application table, as each application has its own down payment. Separating these tables out has made maintenance much harder.
You’re storing the column with application numbers twice to create the join, thereby wasting storage space.
You need to manage the interaction between the two tables when you run queries on the down payments (filters, etc.). The calculation will be much slower, so you’re also sacrificing performance.
It would be much simpler to have a single table for mortgage applications, with a separate column for down payments.
Luckily, you can merge the tables by adding a new column to the right on the event table (mortgage applications) and adding the down payments.
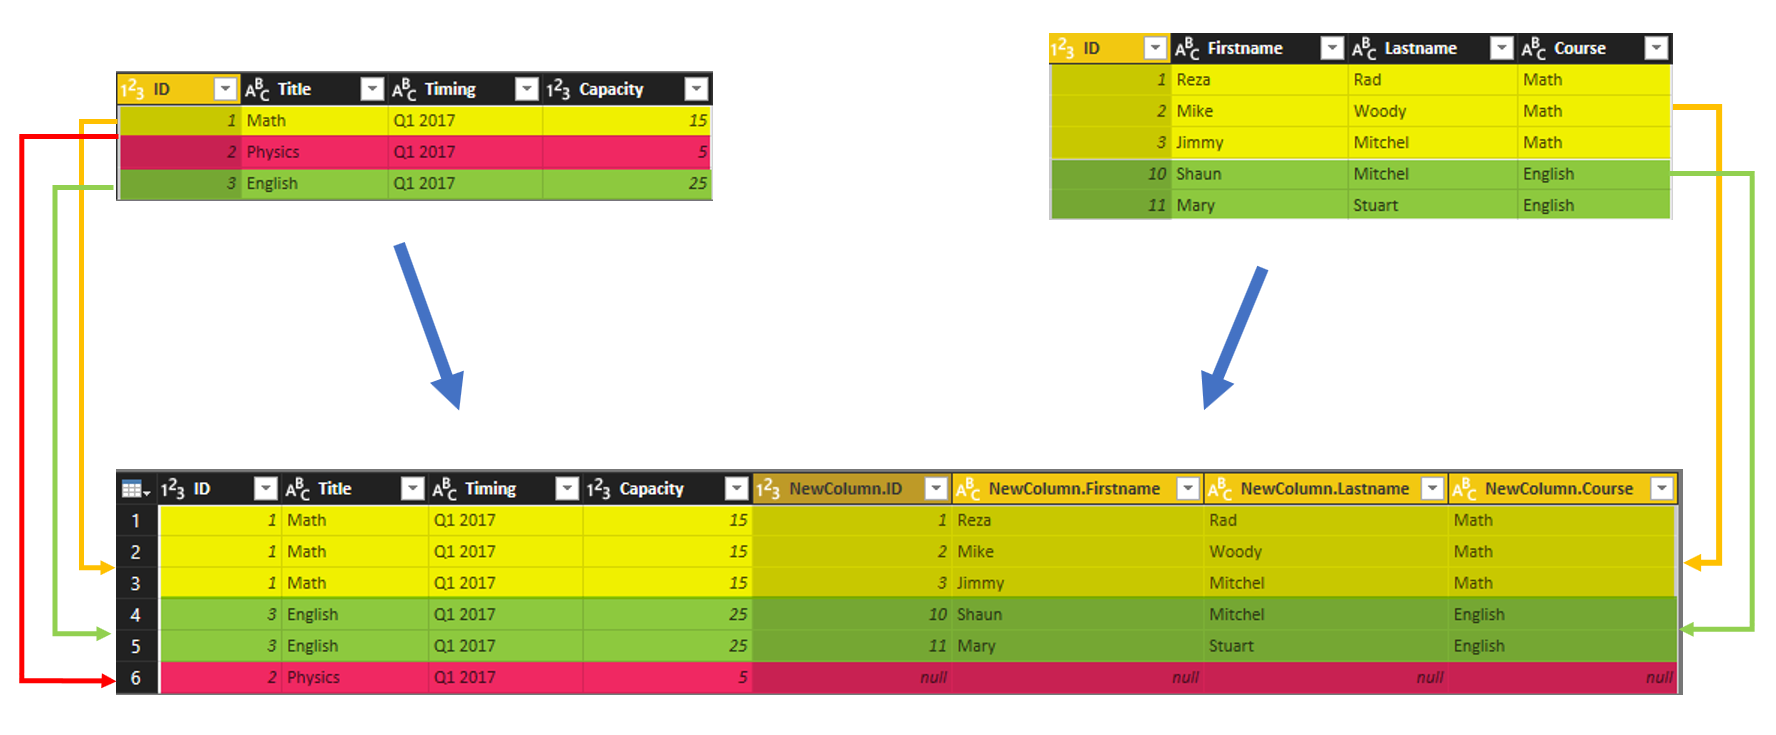
Let’s take a look at how to merge queries between the mortgage-application table and the down-payment table:
Create Different Roles to Manage Data Confidentiality
Now that the data model is complete, you can also handle the data-confidentiality request you got from Global Bank.
It is essential that branch managers and advisors are not able to access data from the whole of the bank network via the dashboard.
They should only have access to data from their branch.
In the next video, we’ll look at how to create different roles in Power BI, and how to manage data confidentiality using these roles.
Let’s Recap!
With Power BI, you can create relationships between your data tables to perform cross-tab queries.
The star schema separates fact tables, which store events, and dimension tables, which describe the things that you are modeling.
Star schema design is very important for developing models in Power BI and ultimately optimizing performance and maintenance.
You may need to combine tables, either by appending or merging.
To restrict the visibility of your data to only certain users, you need to configure different roles in Power BI.
In the next chapter, we’ll see how to create new data out of existing data!
