Formalize Your Designs Using Standard Tools
In the previous chapter, you saw some best practices and practical examples for presenting your architecture.
In this chapter, you'll see some standard tools for documenting your project and its architecture to help you write formal and professional documentation.
Describe What Your System Does
Let’s start with an example:
You and your team are going to develop a new software application for your country’s immigration services. There’s a serious problem in the immigration zone of the country’s main airport. When travelers from a particular group of countries arrive and present their passports, the customs officer has to switch screens and search another system for specific data. This significantly delays the entry process to the country and leads to long lines, which leads to user complaints—many travelers have expressed their general dissatisfaction with the system's inefficiency.
You and your team will develop version two of the system, which consists of an update that will work in all airports in the country. It should solve this problem and add extra features.
You’re going to write the documentation for this new system. It will be used by developers, database administrators, UX designers, and product managers.
Should you mention the problem described above?
Of course! You should include the current problem and explain how version two will resolve it.
Give your team an insight into the real-world context by explaining the problems that will be solved when the system is operational.
Use Diagrams to Illustrate Systems
Use a Convention: UML
UML helps visualize the architectural components of a system, such as:
System activities.
Individual components of the system and how these interact with other software components.
How the system will work.
How the entities interact with others (components and interfaces).
External user interfaces.
Here’s how a class is shown in UML:
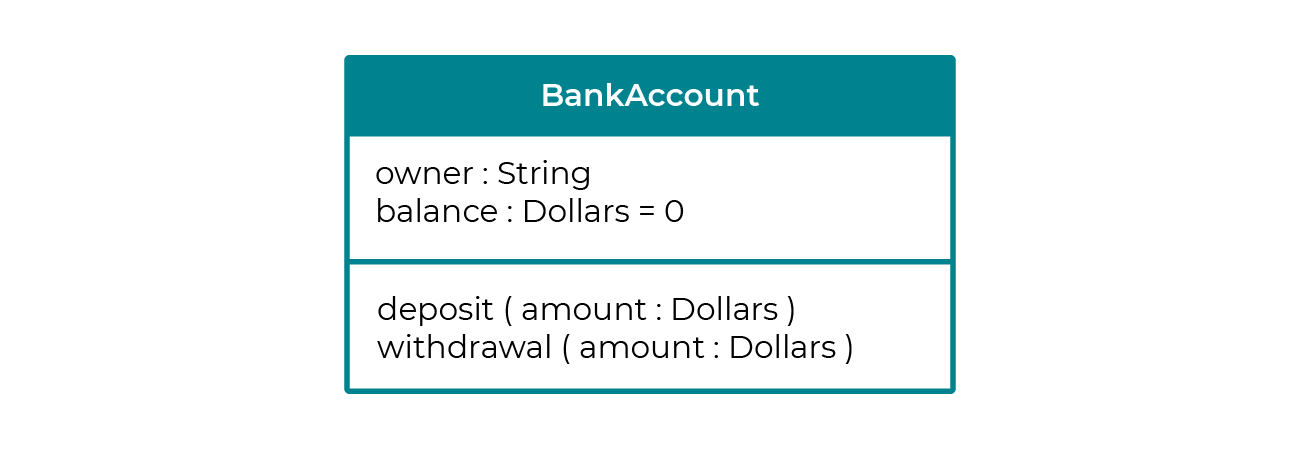
This is a class called Bank Account.
This class has two attributes: the account holder, in string format, and the balance of the account, a numerical field in US dollars.
The class comprises two methods: a deposit and a withdrawal of an amount into the account.
Here’s how an interaction between components is shown in UML:

This is a diagram of a restaurant. There are two actors involved: the food critic and the chef. The ellipses inside the rectangle correspond to the processes that take place within the restaurant.
Can you describe the software system that you and your team will develop using this type of virtual component? This description takes time, but it helps everyone involved clearly understand your system once finished. It makes more sense when you explain your system visually, so it’s worth taking the time to do it!
Use Your Creativity for More Personalized Diagrams
I’m going to show you a second way of documenting a system that is more natural and easier but requires more creativity.
If you want to quickly sketch out your ideas, you can always put pen to paper.
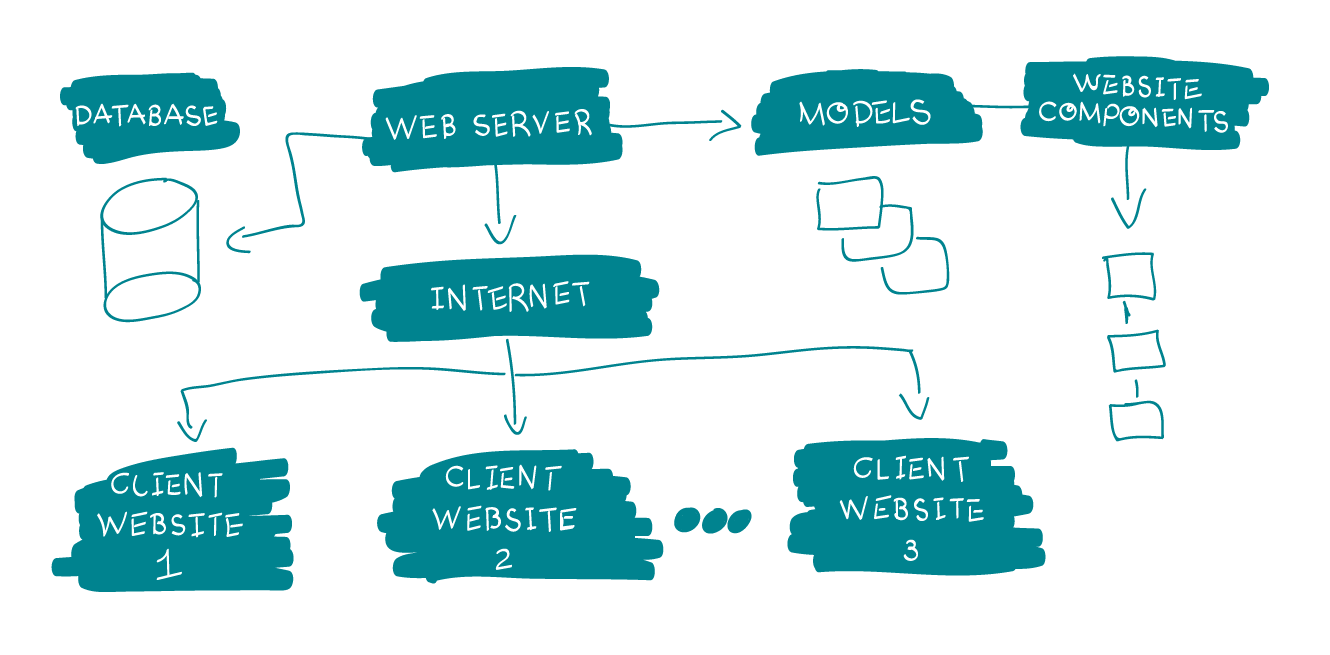
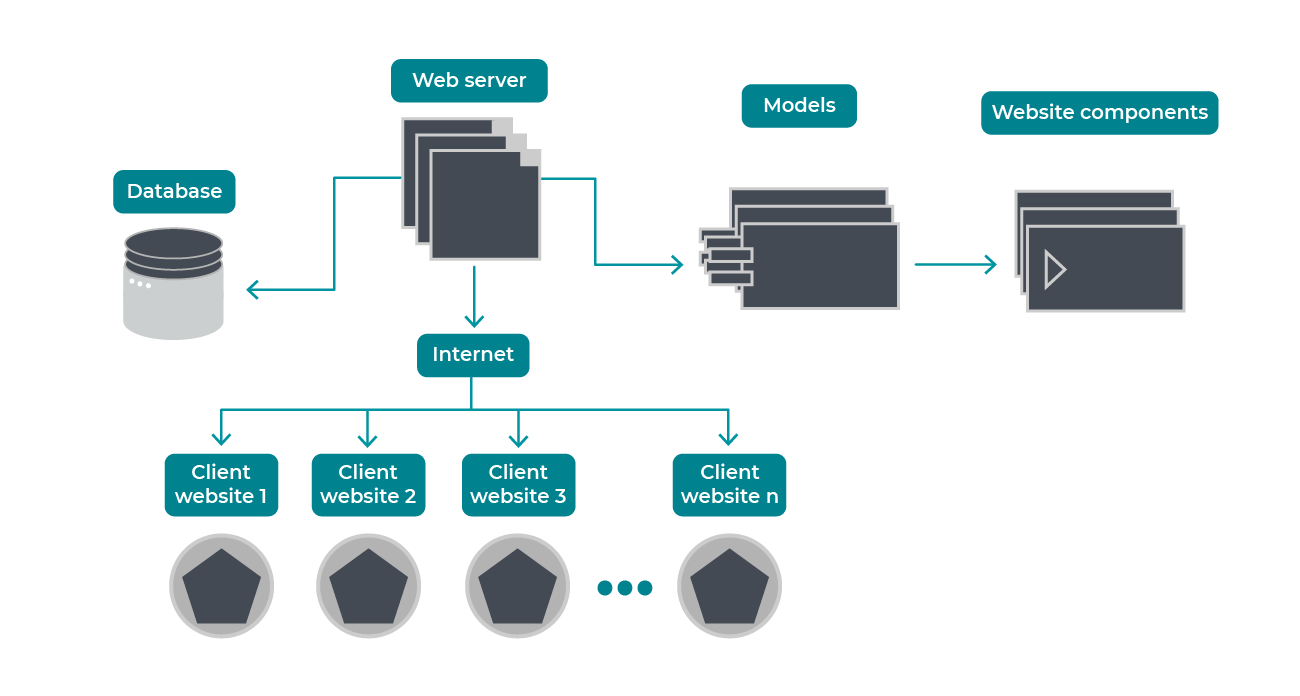
However, once you’ve finished your drawing, you’ll need to create a more polished digital version to share it with your colleagues. It might look like this:
Describe Features With User Stories
User stories are often written from the end user’s point of view and are widely used within agile projects. They are often written on index cards, Post-its, or in project management software and use the following syntax:
As a (ROLE), I want (ACTION) so that (OBJECTIVE).
For example:
As a client, I want to see a list of my previous orders on the website with the detail of each one so that I can consult my order history.
You can say that the functionality of a system is a series of case studies like this one, which are given to the developers. In agile projects, user stories are often presented and managed on storyboards.
Let’s take this simple diagram of a system for sending messages as an example:
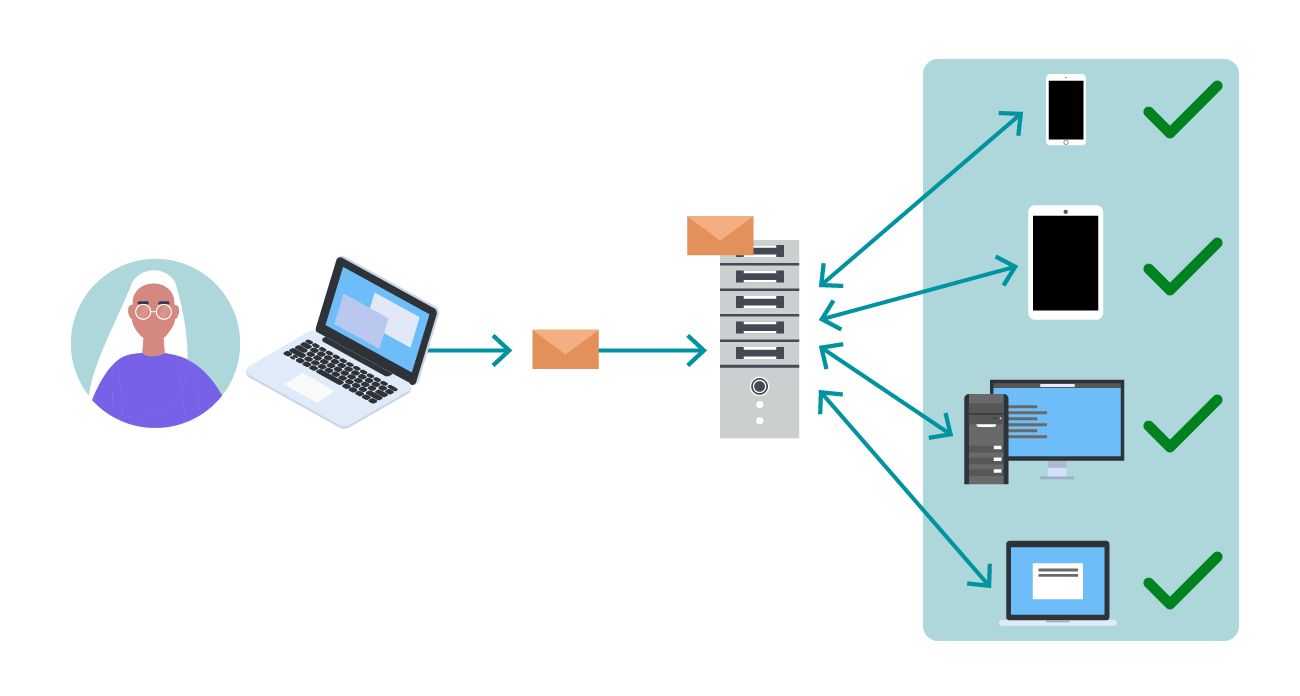
You have a user and an email. The message is stored on a messaging server. This server sends and receives messages from smartphones, tablets, PCs, and laptops.
How can we describe this situation with a user story?
Like so:
As a system user, I want to write a message to a contact and send it so that they can read it immediately on any device.
User stories are generally written on index cards or Post-its, but they can also be written using digital tools such as Miro :

In an agile project, a set of user stories is called a product backlog. Each user story is assigned to a team member—in this case, Alex.
Explain the Frequency and Type of Data Flows
Another point to consider is the frequency of interactions between components. When does the process start? How does it end? What happens in between?
Here’s a sequence of events that creates a data flow with real data:
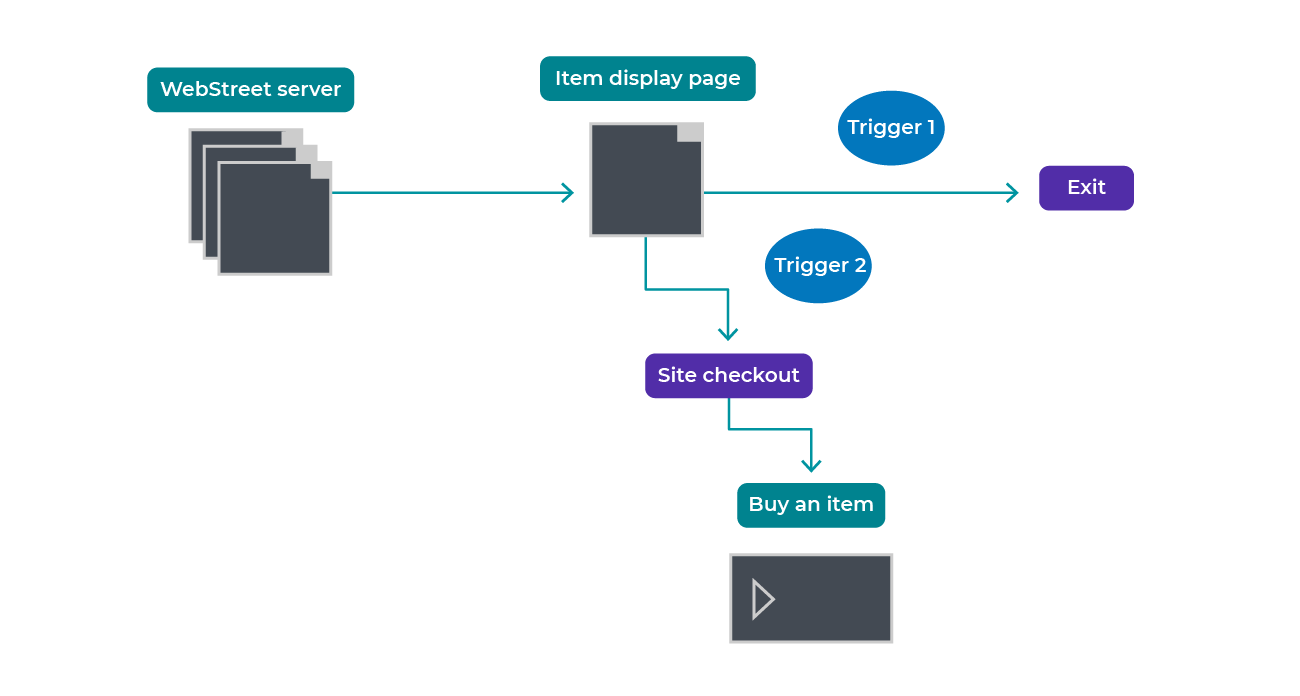
When does the process start? A client browses a WebStreet website and views a list of items. He’s interested in one of the items on the list and clicks on it.
What happens in between?
The client clicks on the Exit button.
The client clicks on one of the items in the list. In this case, the checkout screen appears, and the client buys the item.
How does it end? The data flow can end in two ways:
The client clicks on the Exit button.
The client buys an article.
In this case, you can say that the user started the process when they clicked on the item they wanted to buy. This is an asynchronous process. There are also synchronous processes, i.e., batch processes, which run every evening at the same time.
You’ve now reached the end of this course! I hope you’ve learned some good tips for writing your own self-documenting and documented code to help communicate with your colleagues. Now it’s time for the last quiz of the course to test your knowledge.
Let’s Recap!
Use diagrams—a diagram is a symbolic representation of information using visualization techniques.
Use Unified Modeling Language (UML), a general language for modeling and development, which helps visualize the design of a system in a standardized format.
Use hand-drawn diagrams.
Write user stories to describe the features of a system: the behavior of inputs and outputs traveling through a user interface:
“As a (ROLE), I want (ACTION) so that (OBJECTIVE).”Explain how interactions and data in diagrams change over time.
Specify in your documentation whether your processes are synchronous or asynchronous. Document the triggers.
