Discover How You Are Already Interacting With Data
Analyze the Role of Data in Your World
As an individual living in the world today, you are generating a huge amount of data that's being used in various ways to make decisions that affect you.
Depending on your level of data awareness, this statement may be obvious to you, or it may be a complete surprise! Either way, consider the data in your life.
But what is data?
The ways that you generate data may surprise you. Much of it comes from interactions with these hidden computers and the more obvious ones. It’s estimated that we currently have, on average, nearly 1,000 of such interactions per day, and this will increase to around 5,000 by 2025 (S. O'Dea, 2020)
Let’s get into your first activity…
Your Turn! Data About You

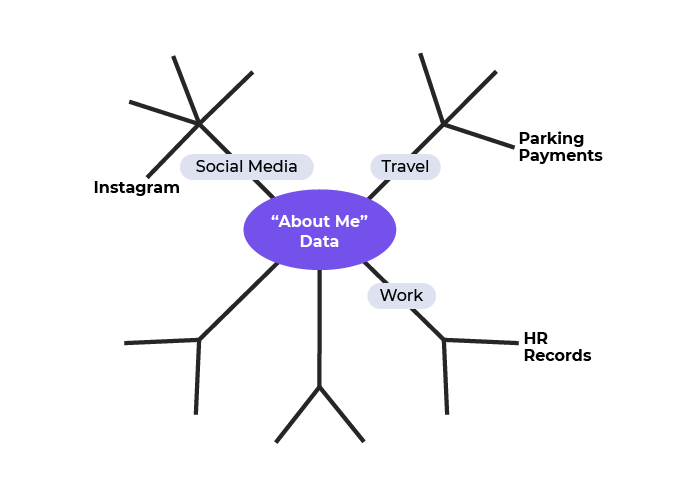
Grab a piece of paper and write down a list of all the places where data about you is gathered or stored. Group them into categories if it helps. I’ve started it off for you with an example. Don’t over-analyze this! Just write down whatever comes to mind.
After working on this for a few minutes, you will see the list grow very long!
Now take one or two examples and write down how you think that data about you is being used.
Depending on your chosen items, you may find quite a few ways.
✅ Check your work: How did you do? You can check my answers here!
In addition to data about you, there is also data you use daily. Here are a few examples:
Data about travel routes when planning a journey using a mapping or journey planning app on your phone.
Data about places to see in Rome, which you use when doing a web search for things to do on your vacation.
Data about the temperature in your house, which your thermostat uses to control your heater.
I’m sure you can think of some more examples!
Understand the Real and Potential Value of Data
So now you have a sense of what data is, but did you know that some is more useful than others? Sometimes, you can take data and make it more valuable, as you will see.
First, let’s remember the definition of data:
Here is a data item:
The current temperature is 69°F.
This data item could also be presented like this:
Current temperature: 69°F.
Or like this:
| Temperature (°F) |
Current | 69 |
This tabular form is a common and helpful way to present data. You will see much more of this in the course. One of the nice things about this form is that you can store multiple items of data like this:
| Temperature (°F) |
Sunday | 66 |
Monday | 67 |
Current | 69 |
You can expand upon the data, enriching it with some textual descriptions:
| Temperature (°F) | Weather |
Sunday | 66 | Cloudy |
Monday | 67 | Rain |
Current | 69 | Sunny |
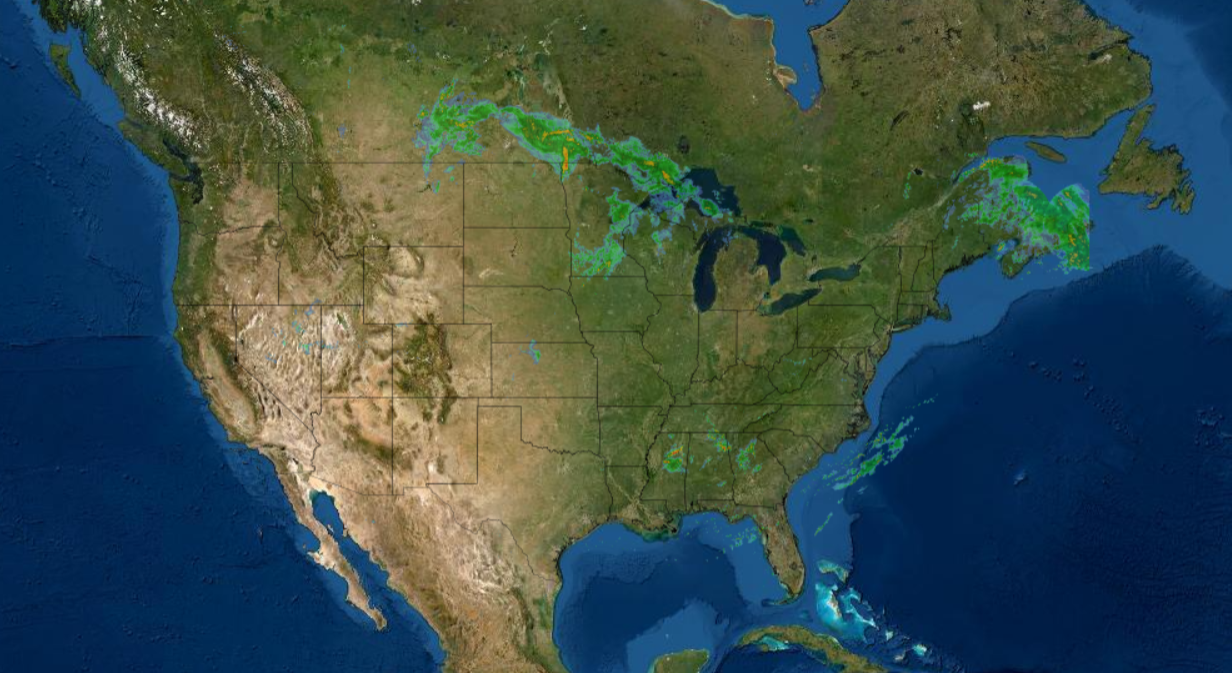
Here is some more data in image form: a radar weather map of the U.S.

In the data world, information is more valuable than data. This is because the raw data doesn’t inform you; information does!
So, what is information?
Adding value can take many forms:
Refining and structuring the data
Adding context to the data
Applying some heavy-duty computer power to the data
Okay, so, how can I turn the data you showed me into useful information?
| Temperature (°F) | Weather |
Sunday | 66 | Cloudy |
Monday | 67 | Rain |
Current | 69 | Sunny |
The chart above is missing some context. Where were these measurements recorded? When were they recorded? What are the units of measurement? So let’s add this to the data to turn it into some useful information:
Where | When | Temperature (°F) | Weather |
Boston (Public Garden) | Sunday, May 24, 2022 | 66 | Cloudy |
Boston (Public Garden) | Monday, May 25, 2022 | 67 | Rain |
Boston (Public Garden) | Tuesday, May 26, 2022 | 69 | Sunny |
Don’t you agree that this is more useful?
What about the satellite image? How can I turn that into useful information?
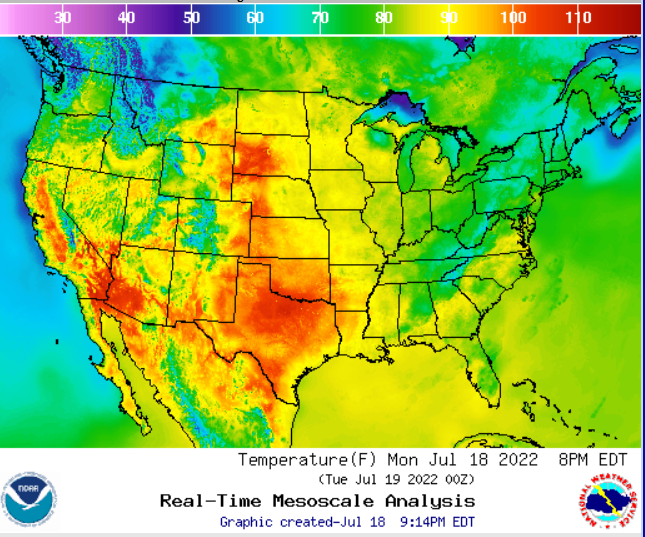
Perhaps you can overlay it with meteorological data. This looks like more useful information:
So once I have information, what can I do with it?
There may be many things, but it should provide insight.
Furthermore, you want any insights you get from the data to be actionable and encourage you to take some action confidently.
Consider our weather example:
Where | When | Temperature (°F) | Weather |
Boston (Public Garden) | Sunday, May 24, 2022 | 66 | Cloudy |
Boston (Public Garden) | Monday, May 25, 2022 | 67 | Rain |
Boston (Public Garden) | Tuesday, May 26, 2022 | 69 | Sunny |
In this case, the insight might be, “It’s getting warmer,” and the action might be, “Better go and buy some summer clothes!”
As a data-literate person, your aim is to discover actionable insights in the data.
The transition from data to action can be summarized like this:
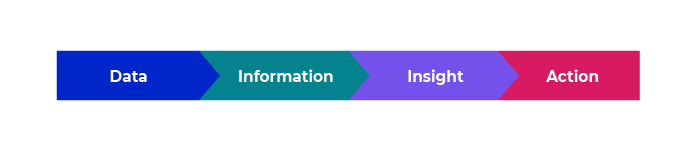
This illustrates the key objective of data professionals and data-literate individuals - to be data-driven!
Consider the Role of Data in the Broader World
Anyone over 30 years old has seen a massive transformation in how we live, work, and play due to the explosive use of computers and data. The magic wand of data analytics has touched many areas that were not traditionally computerized or data-heavy. Let’s look at some examples.
Education
Schools, universities, and other educational establishments can use data to track learning outcomes and achievements. It can help make improvements to teaching methods and delivery. For example:
Using continuous assessment to quickly identify struggling students and arranging early intervention to support them.
Supporting self-guided learning by using data analytics to ensure students master the subject matter.
Personal Finance
Modern online banking provides convenience and offers ways to manage your finances effectively. For example, it can help you by:
Categorizing your spending so you can understand your spending habits over time.
Setting financial goals and tracking your progress to encourage you to save money.
Smart Homes
A growing trend is for people to transform their homes into “smart” homes. These homes can use computers to monitor and manage things such as lighting, heating, and security, which provides potential benefits, such as:
Convenience, e.g., automatically adapting heating to your daily routine.
Optimization, e.g., reducing bills by identifying energy usage patterns.
There are many more examples. Going beyond the smart home, there is the smart city concept, where data is collected to optimize how people and businesses interact in urban areas. In the video, I discussed how car data helps you plan your journey and stay safe on the road. Data is key to healthcare, security, retail industry, logistics, and numerous other fields.
Let’s Recap!
In this chapter you learned that:
Data is everywhere! Areas of life that were previously not data-rich are becoming data-driven.
Individuals interact with, use, and produce tremendous amounts of data daily.
The amount of data is growing fast.
If you know how to work with data, you can enhance it, add value, turn it into information, draw insights, and encourage actions.
Now that you understand what data is and its role in the world, you are ready to learn to take advantage of it. In the next chapter, we will explore what it takes to be data literate and how this will improve your interaction with the world!
