Explore the Concept of a Data Pipeline
Discover the Data Pipeline
By now, it is pretty clear what data is, but where does it come from? And where does it go?
In the data world, you'll often hear about data pipelines, which can be compared to a factory. For example, in a cookie factory, you have raw ingredients (flour, butter, and sugar) going in one end. Then you have the product, cookies, coming out of the other end. Finally, in the middle, you have a transformation process, (i.e., a set of operations or processes executed in the correct sequence):
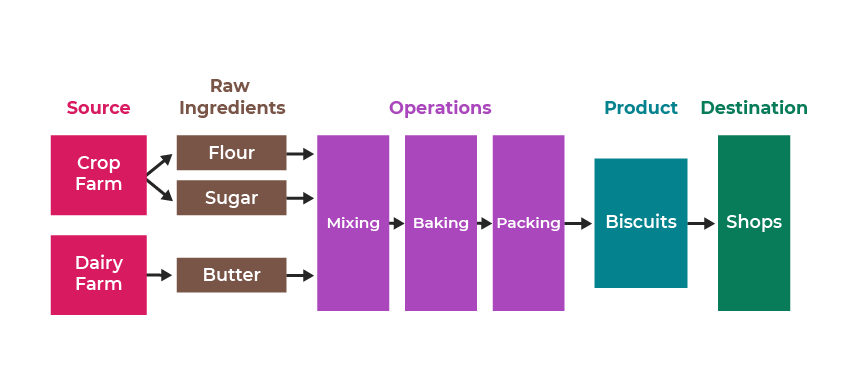
The factory has taken raw ingredients and added value, turning them into something more refined and useful to the everyday person. Likewise, as you become more data literate, you will be able to transform raw data into something useful, just like the factory workers do with flour, sugar, and butter. So let’s start looking at the magical transformation process for your data!
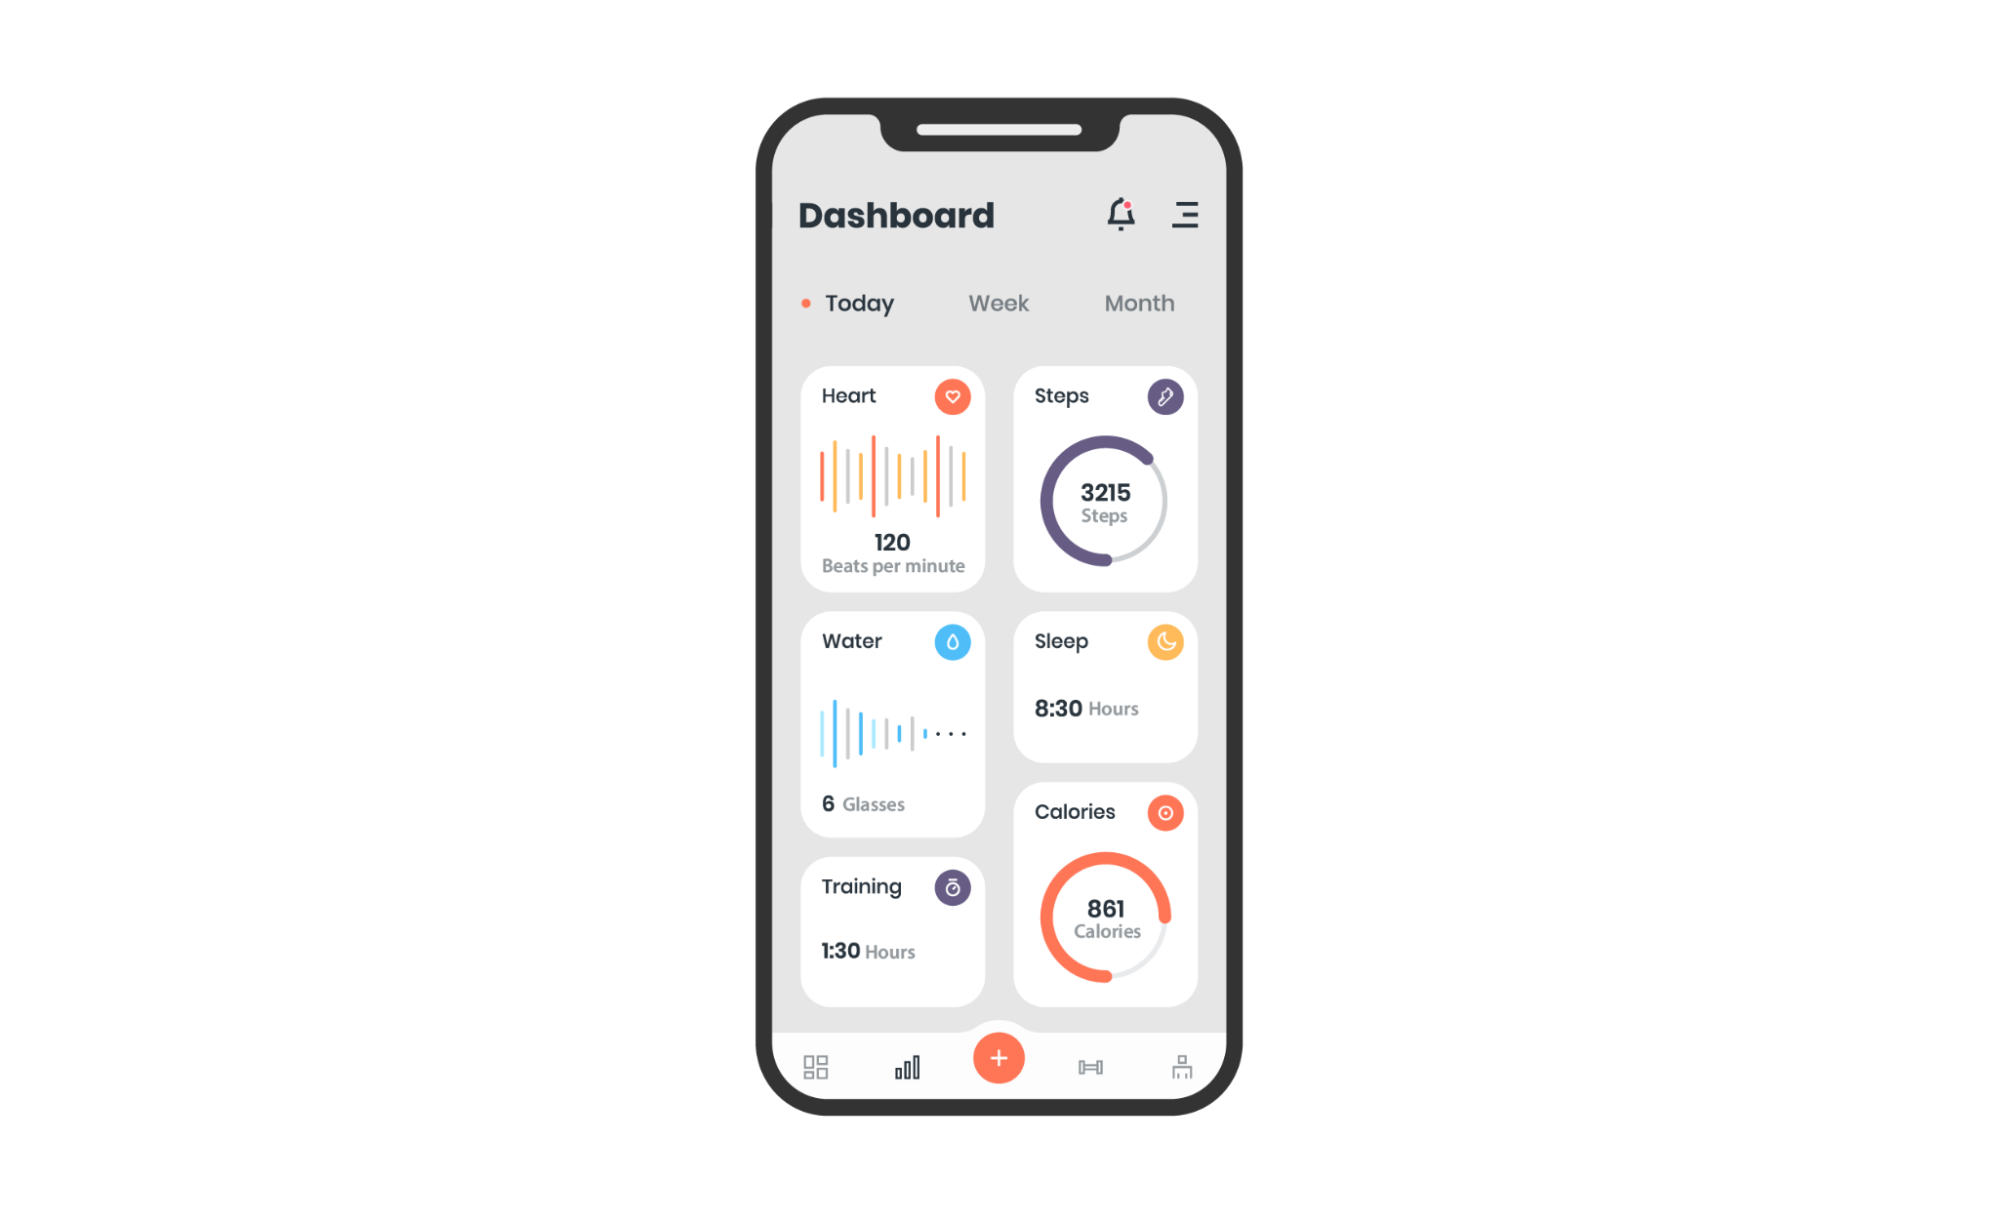
Consider the scenario of a newly health-conscious individual. Your friend Zara has bought a fitness tracker that can track her steps and distance she's moved (whether by walking, running, cycling, etc.). She hopes this is the start of a journey to better all-around health and fitness. She’s even taken up cycling! Since you have expressed your interest in working with data, Zara has asked you to help her on this journey. She wants you to use your data skills to add value to her fitness data.
What data can I extract from the app to follow Zara’s fitness journey?
Data Sources and Raw Data
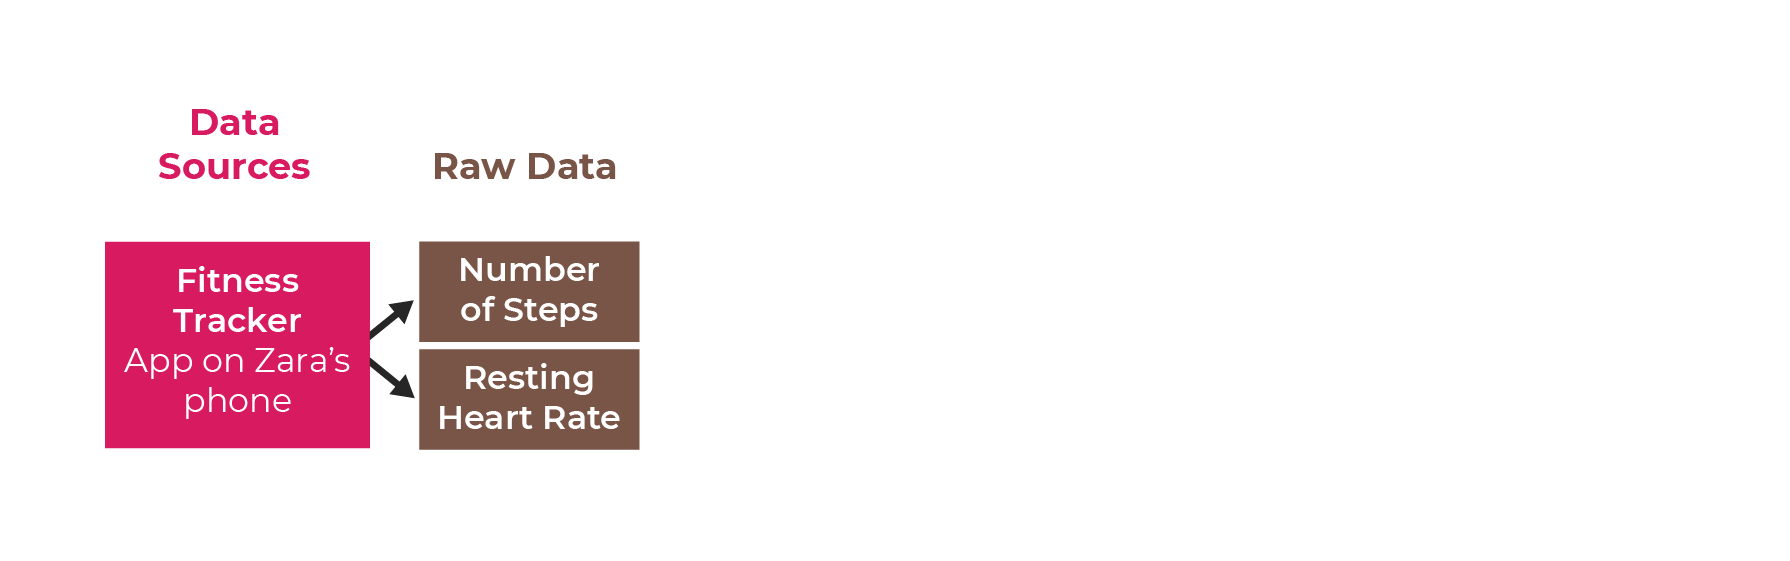
You can start by building the first stage of the data pipeline, which shows the data sources and the raw data you’re dealing with.
Let’s say the app records the number of steps and Zara’s resting heart rate.
 You can show this on the pipeline like this:
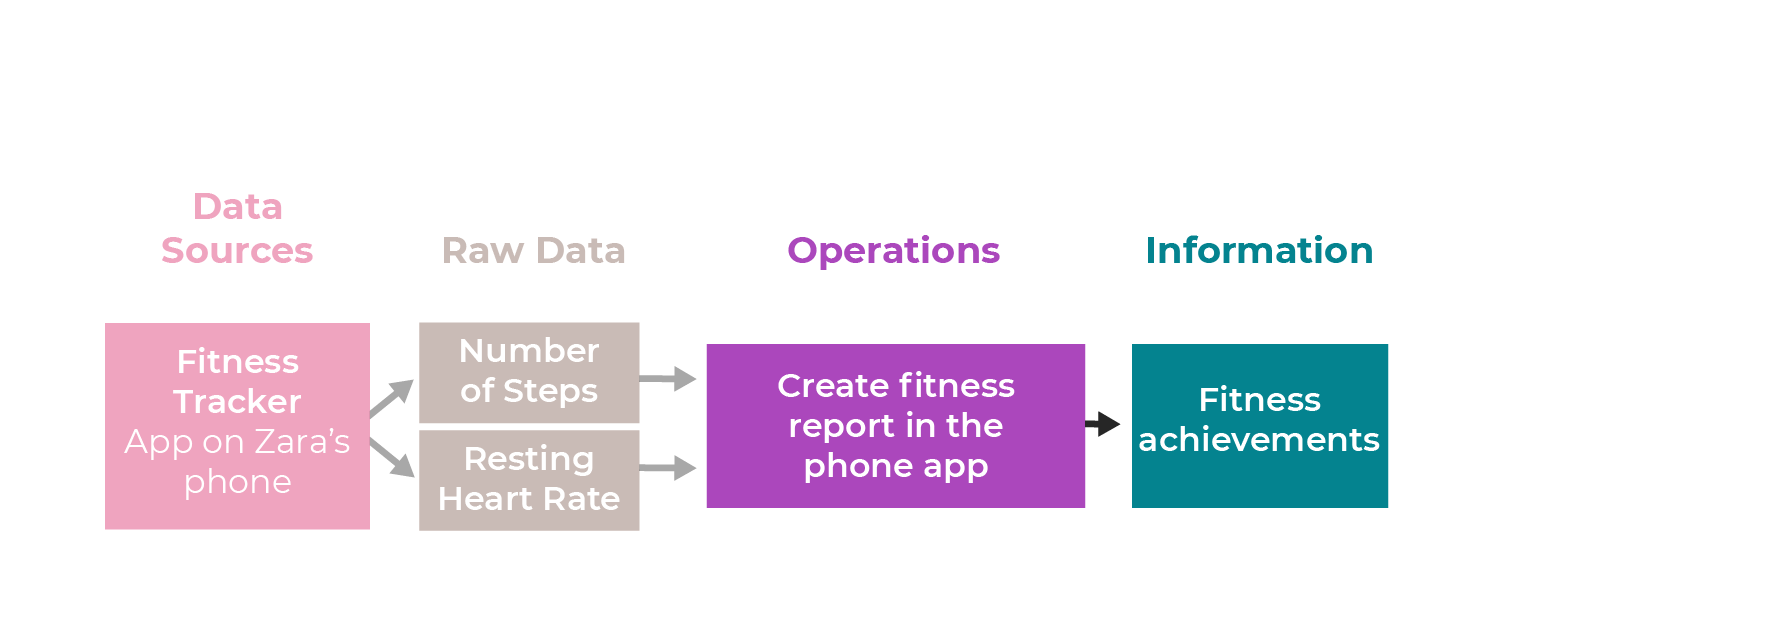
Operations and Information
The next stage in the data pipeline shows the operations you can perform on this data to transform it into useful information. In this case, the app can produce a report that shows Zara’s achievements, such as weekly improvements or beating her previous best day.
Destination
Then you can see the destination (i.e., where this data might go next after processing). Zara might want to share her successes with her friends!
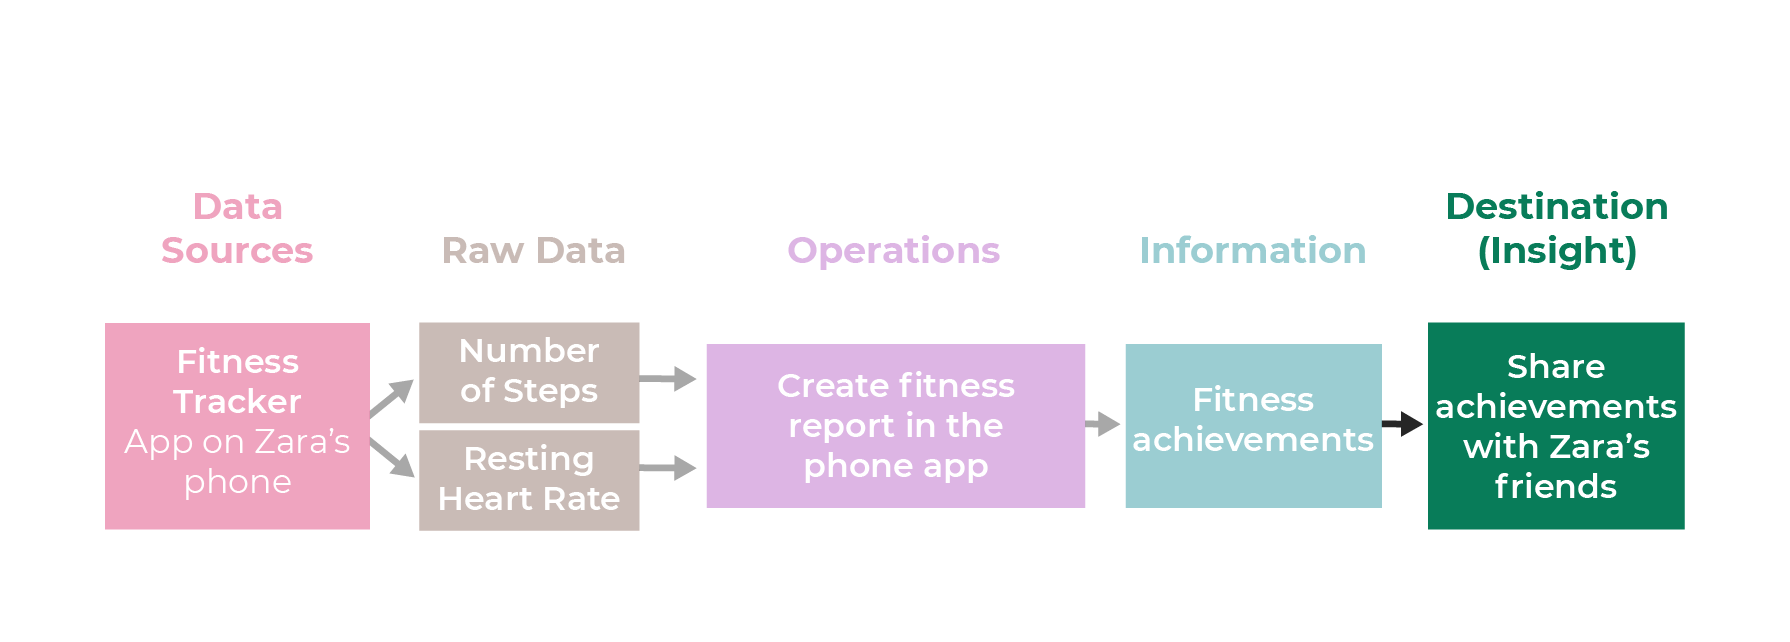
Now you have a data pipeline for Zara’s fitness achievements. It’s like an information factory: raw data goes in one end, and refined, processed information comes out on the other.
Adding More Data to the Pipeline
Can we add more ingredients to our information factory?
Sure! Let’s ask your health-conscious friend to start recording other details about her health, particularly any worrying symptoms she has.
Zara starts to record this data in a spreadsheet that looks like this:
Date | Symptoms |
February 01, 2022 |
|
February 02, 2022 | Headache |
February 03, 2022 | Fatigue |
February 04, 2022 |
|
… | … |
How would you add this new data source to the data pipeline above?
Hopefully, you came up with something like this, which shows the new spreadsheet as a data source and the symptom data coming from the spreadsheet above:
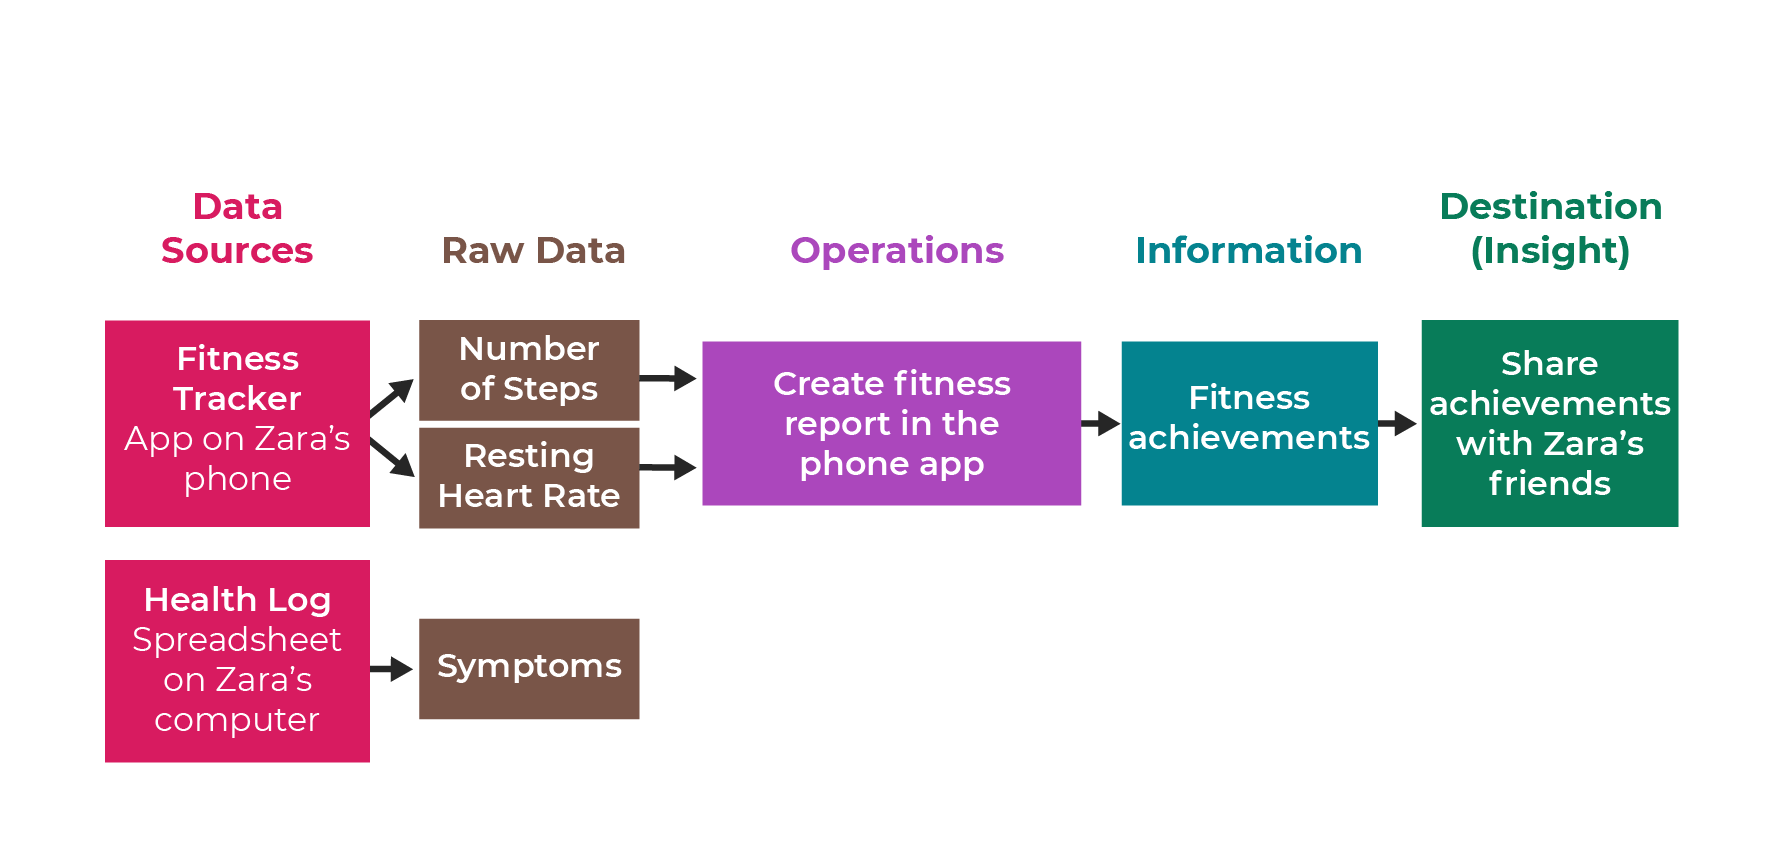
Of course, Zara will want to do something useful with this new data, which we will explore in the next chapter!
Let’s Recap!
In this chapter, you learned that:
A data pipeline is like an information factory. You add value to raw data to transform it into information.
The raw data comes from different data sources.
Operations transform data into information.
You can send the final information to different data destinations.
In this chapter, you saw the basics of turning data into low-value information. Now that you understand the process, you are ready to take it to the next level. In the next chapter, we will extract the maximum value out of data by tailoring the pipeline to specific objectives.
