Find and Collect Data
Identify Where You Can Find Data For Your Project
In the first part, you saw how data pipelines can illustrate how to process data, turn it into information, and draw actionable insights. Sometimes the hardest part of this process is finding some useful data in the first place!
But in Zara’s case, we can take data from her tracker app and health log spreadsheet, right?
Yes and no. The health log should be easy to get because the spreadsheet file is on Zara’s computer. But the fitness tracker app may present some challenges. While she can see the data in the app, we need it in a computer-processable format. There must be some way to extract the data in a form that data handling tools can use, such as a spreadsheet application.
An important consideration when sourcing data is understanding if using it is legal and ethical. It all comes down to ownership and sensitivity.
Discover Ways of Gathering Data
There are numerous ways to gather data. Let’s explore some of them, as outlined in the image below:
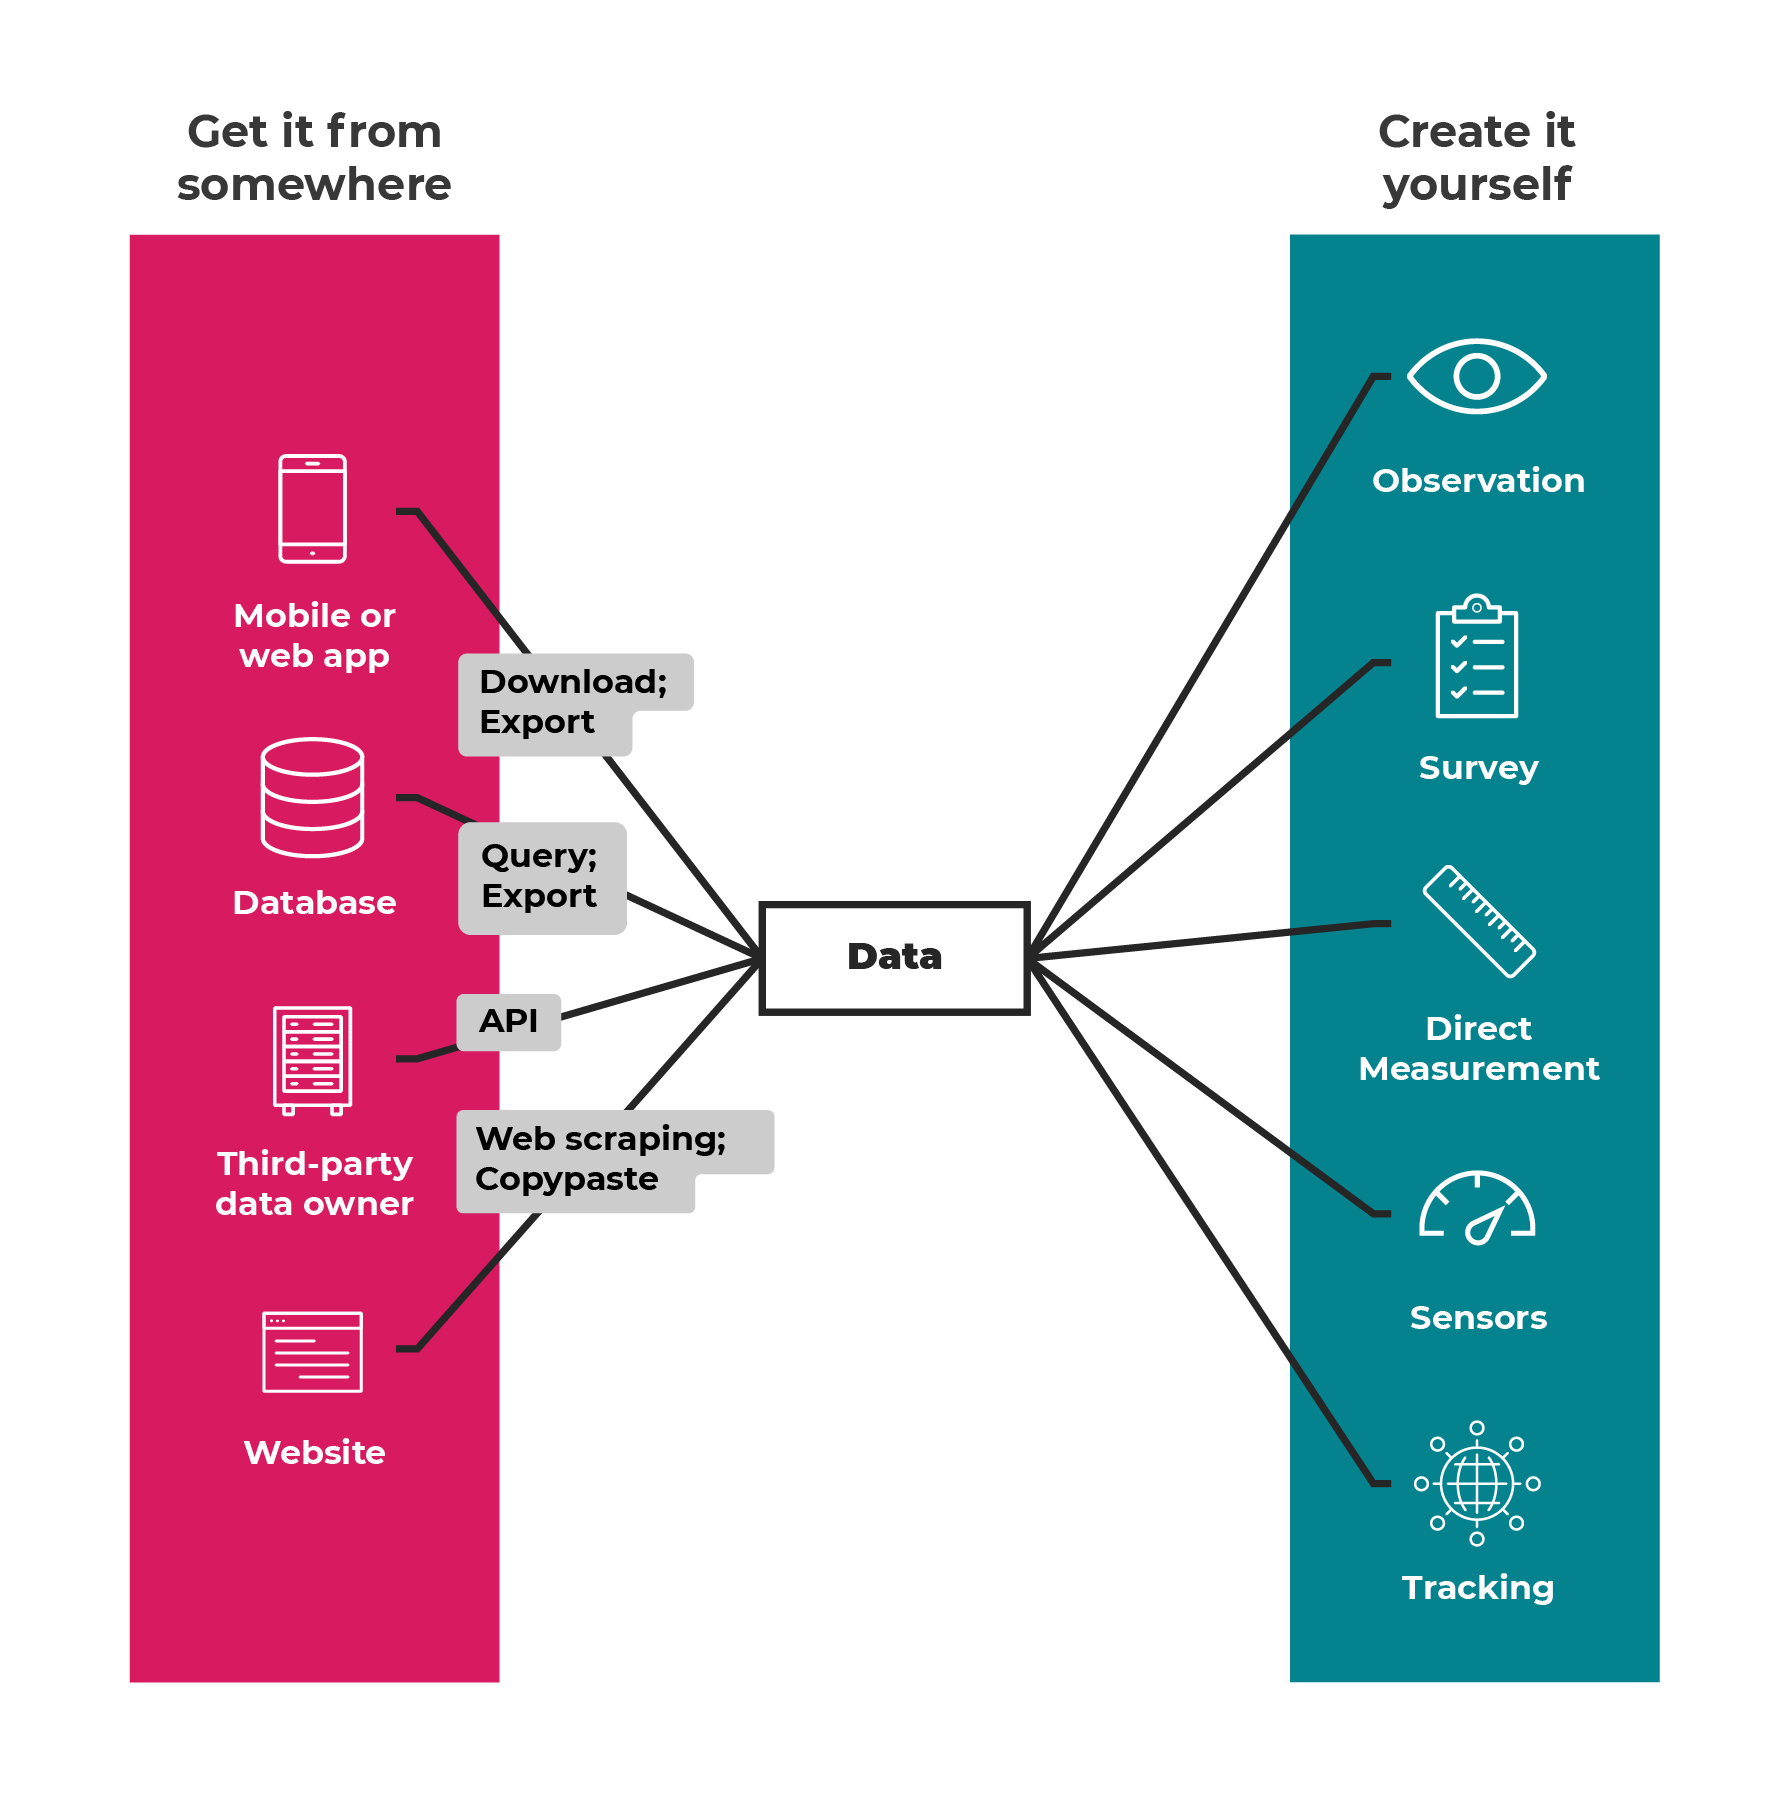 One approach to getting data is creating it yourself, as Zara did with her health log spreadsheet. There are numerous ways to do this.
You could:
use observation (i.e., sitting in a park and counting how many of each type of bird you see)
survey a group of people (i.e., asking questions about who they plan on voting for)
take direct measurements (i.e., the height of trees)
use sensors to automatically gather data (i.e., a temperature sensor in your living room)
use tracking in a whole range of situations (i.e., tracking how many people visit each page on a website).
If the data exists in a mobile or web application, you may be able to download or export it. For example, Zara’s fitness app or its accompanying website may have a download function.
If you are working on a project for your organization, you may find that the data exists in databases. You may be able to access it yourself or speak to someone in your IT department to get an export.
In other cases, a third party might own the data. Therefore, you may need to contact them to access the data, or they may provide an official way to get it yourself, such as downloading from a website or using an API (application programming interface).
Data you see on a web page, such as a table on a Wikipedia page, could be copy-and-pasted into a spreadsheet or gathered by web scraping, which also usually needs programming knowledge.
Assess the Usefulness of the Data
Is all data useful?
No! You want data that you can readily turn into information and insights. There are two key questions to ask:
Is it computer-processable?
Does it have information value?
Data first needs to be stored on a computer to be computer-processable. So, if your data is in a paper-based questionnaire, you must digitalize it first. There are various forms this can take.
The Excel .xlsx file format is useful, as all common spreadsheet programs can open it. The data is computer-processable, but also human-readable. Excel spreadsheets are great for presenting data. Zara’s health log spreadsheet can be formatted and saved in an Excel format, and might look something like this: 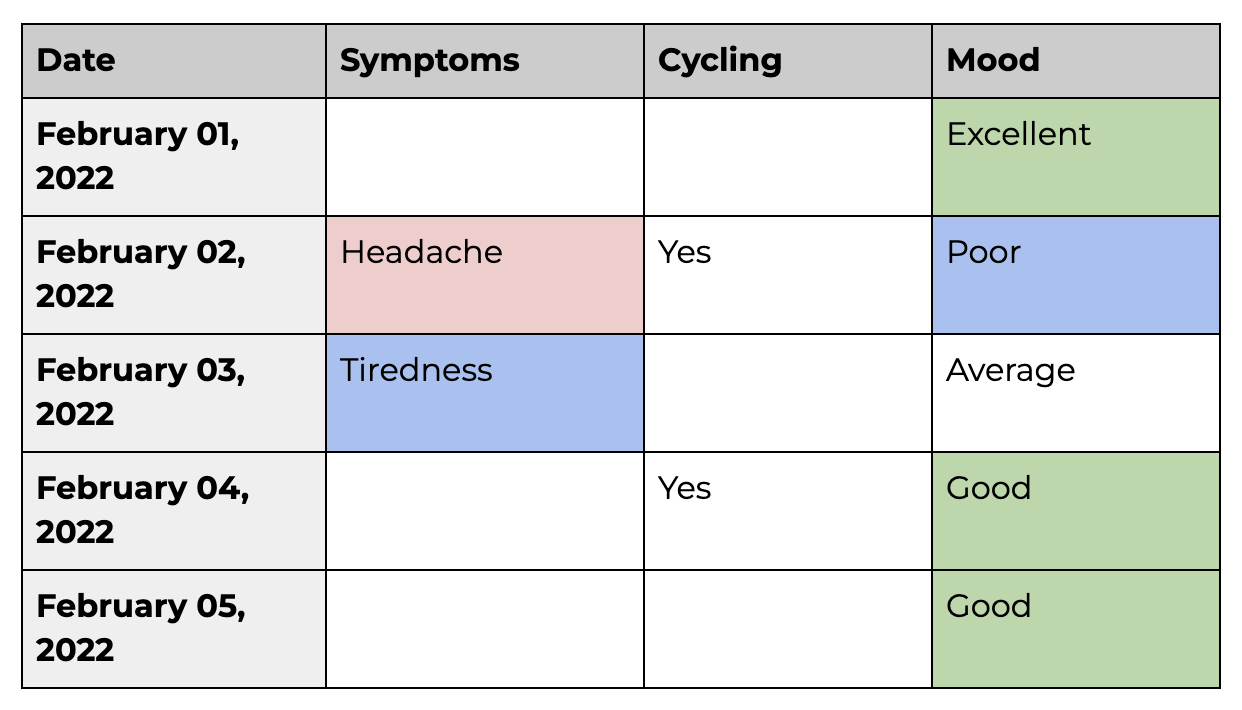
Another helpful format is called CSV (comma-separated values). Spreadsheet programs as Excel, Numbers, or Google Sheets can produce this format. In the same way as Excel, CSV files contain columns and rows in table format. CSV is a plain text format with a series of values separated by commas, so you can think of it like Excel files without the formatting (i.e. without the colors, different fonts, styles, etc).
In the table above, the columns represent data items that can change their value, called variables.
So in the above data, mood is a variable, which can have the values “Excellent,” “Poor,” “Average,” or “Good.”
The above table is an example of structured data.
Conversely, images, videos, and text documents are examples of unstructured data.
Imagine that Zara wants to see if her health issues might be related to her eating habits. So she takes photos of all the meals she eats using her phone. She ends up with a gallery:
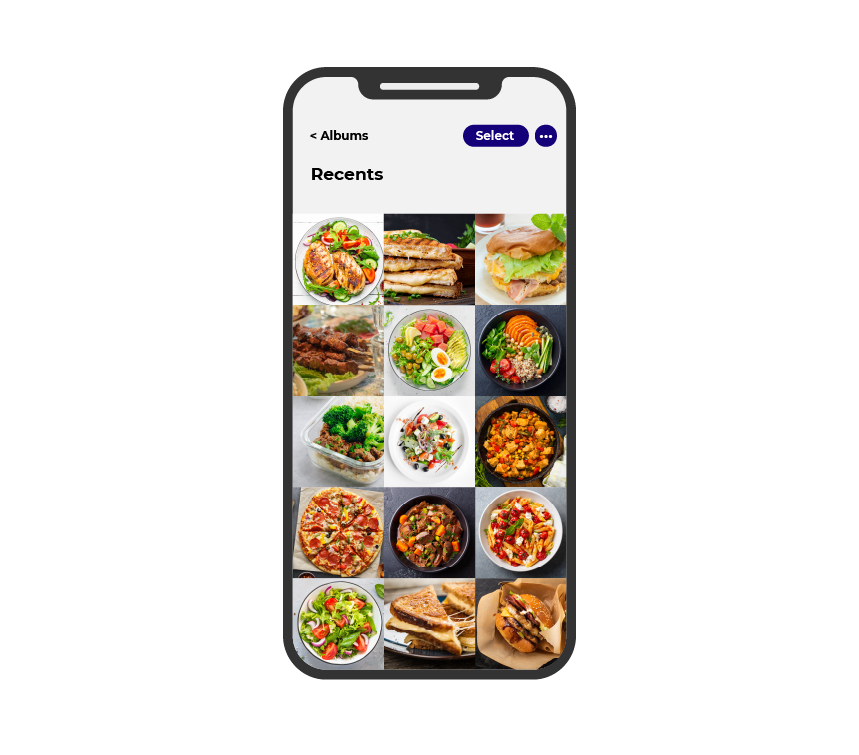
Can you see how this unstructured data is not as easy to use as the tabular, CSV data above? Take an individual photo as an example:

Even though this data is computerized (as an image on Zara’s phone), the information contained within will be hard to extract. As humans, we can look at it and see salmon, asparagus, and cherry tomatoes, but the computer doesn’t immediately have that information. You would need to process the images, either manually (adding this information) or using AI to extract the information (which is not easy!). Ultimately, you want to process the images and end up with data that looks something like this:
Date | Lunch | Dinner |
February 1, 2022 | Tomato soup | Grilled salmon, asparagus, cherry tomatoes |
February 2, 2022 | Cheese sandwich | Mushroom risotto |
February 3, 2022 | Egg salad | Stir-fried chicken with noodles |
February 4, 2022 | Hummus and pita | Pasta with pesto and parmesan |
February 5, 2022 | Roasted vegetable salad | Spinach and lentil curry with rice |
As you can see, it is now structured data. Much more useful!
Now that we know data is computer-processable, it’s time to move on to the second test and see whether it has information value.
There is a mathematical way to compute whether data has information value, but we won’t go into that here :). But you can often spot when data might or might not have information value. Take Zara’s fitness data, for example:
Date | Total Steps | Resting Heart Rate |
01/02/22 | 8372 | 68 |
02/02/22 | 4928 | 67 |
03/02/22 | 4941 | 67 |
04/02/22 | 9783 | 68 |
05/02/22 | 7994 | 67 |
06/02/22 | 7682 | 67 |
07/02/22 | 7881 | 68 |
… | ... | … |
Notice how the Total Steps vary quite a bit daily, whereas the Resting Heart Rate is stable, only varying from 67 to 68. Zara would hope that the variance in the Total Steps data could explain something else in the data, such as her varying mood. However, looking at the Resting Heart Rate data, the lack of variance doesn’t give you much opportunity to glean any sort of insight about Zara’s health and fitness.
It’s helpful to think of information value as data’s explanatory power. So as you gather data, try to ask yourself if it has information value by asking whether it has the potential ability to explain a pattern or observation.
Your Turn: Practice Collecting and Accessing Data

Now it’s time for some hands-on practice! First, you are going to help Zara by gathering some data for her into some data files. This group of data files is called a data set.
Data from the fitness app
Zara has exported the data from her fitness app for February to a file called fitness_tracker.xls. You can download the file here.
Health log spreadsheet
Zara has created a spreadsheet named health_log.xlsx, containing her health log. You can download the file here.
Food photos
Now it’s time to gather some data. Zara has downloaded the food photos from her phone and stored them here. She is just taking a picture of her main meal each day. Can you help her by turning this unstructured data into structured data? Create a new spreadsheet containing three columns: date, healthiness of the meal and how substantial it is. The first few rows should look like this:
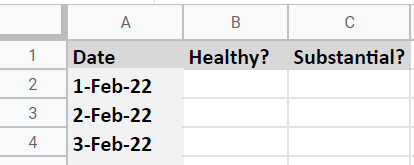
Name the spreadsheet Food Log.
Now fill out the spreadsheet based on the photos. The “Healthy?” column should simply say whether you consider the meal to be healthy or not. Put the word “no” next to a date if you think the food is unhealthy and leave it blank if you think it is healthy. The “Substantial?” column should indicate if you think the meal is substantial or not.
Watch this screencast to see how I performed the above steps:
You can download my completed worksheet here.
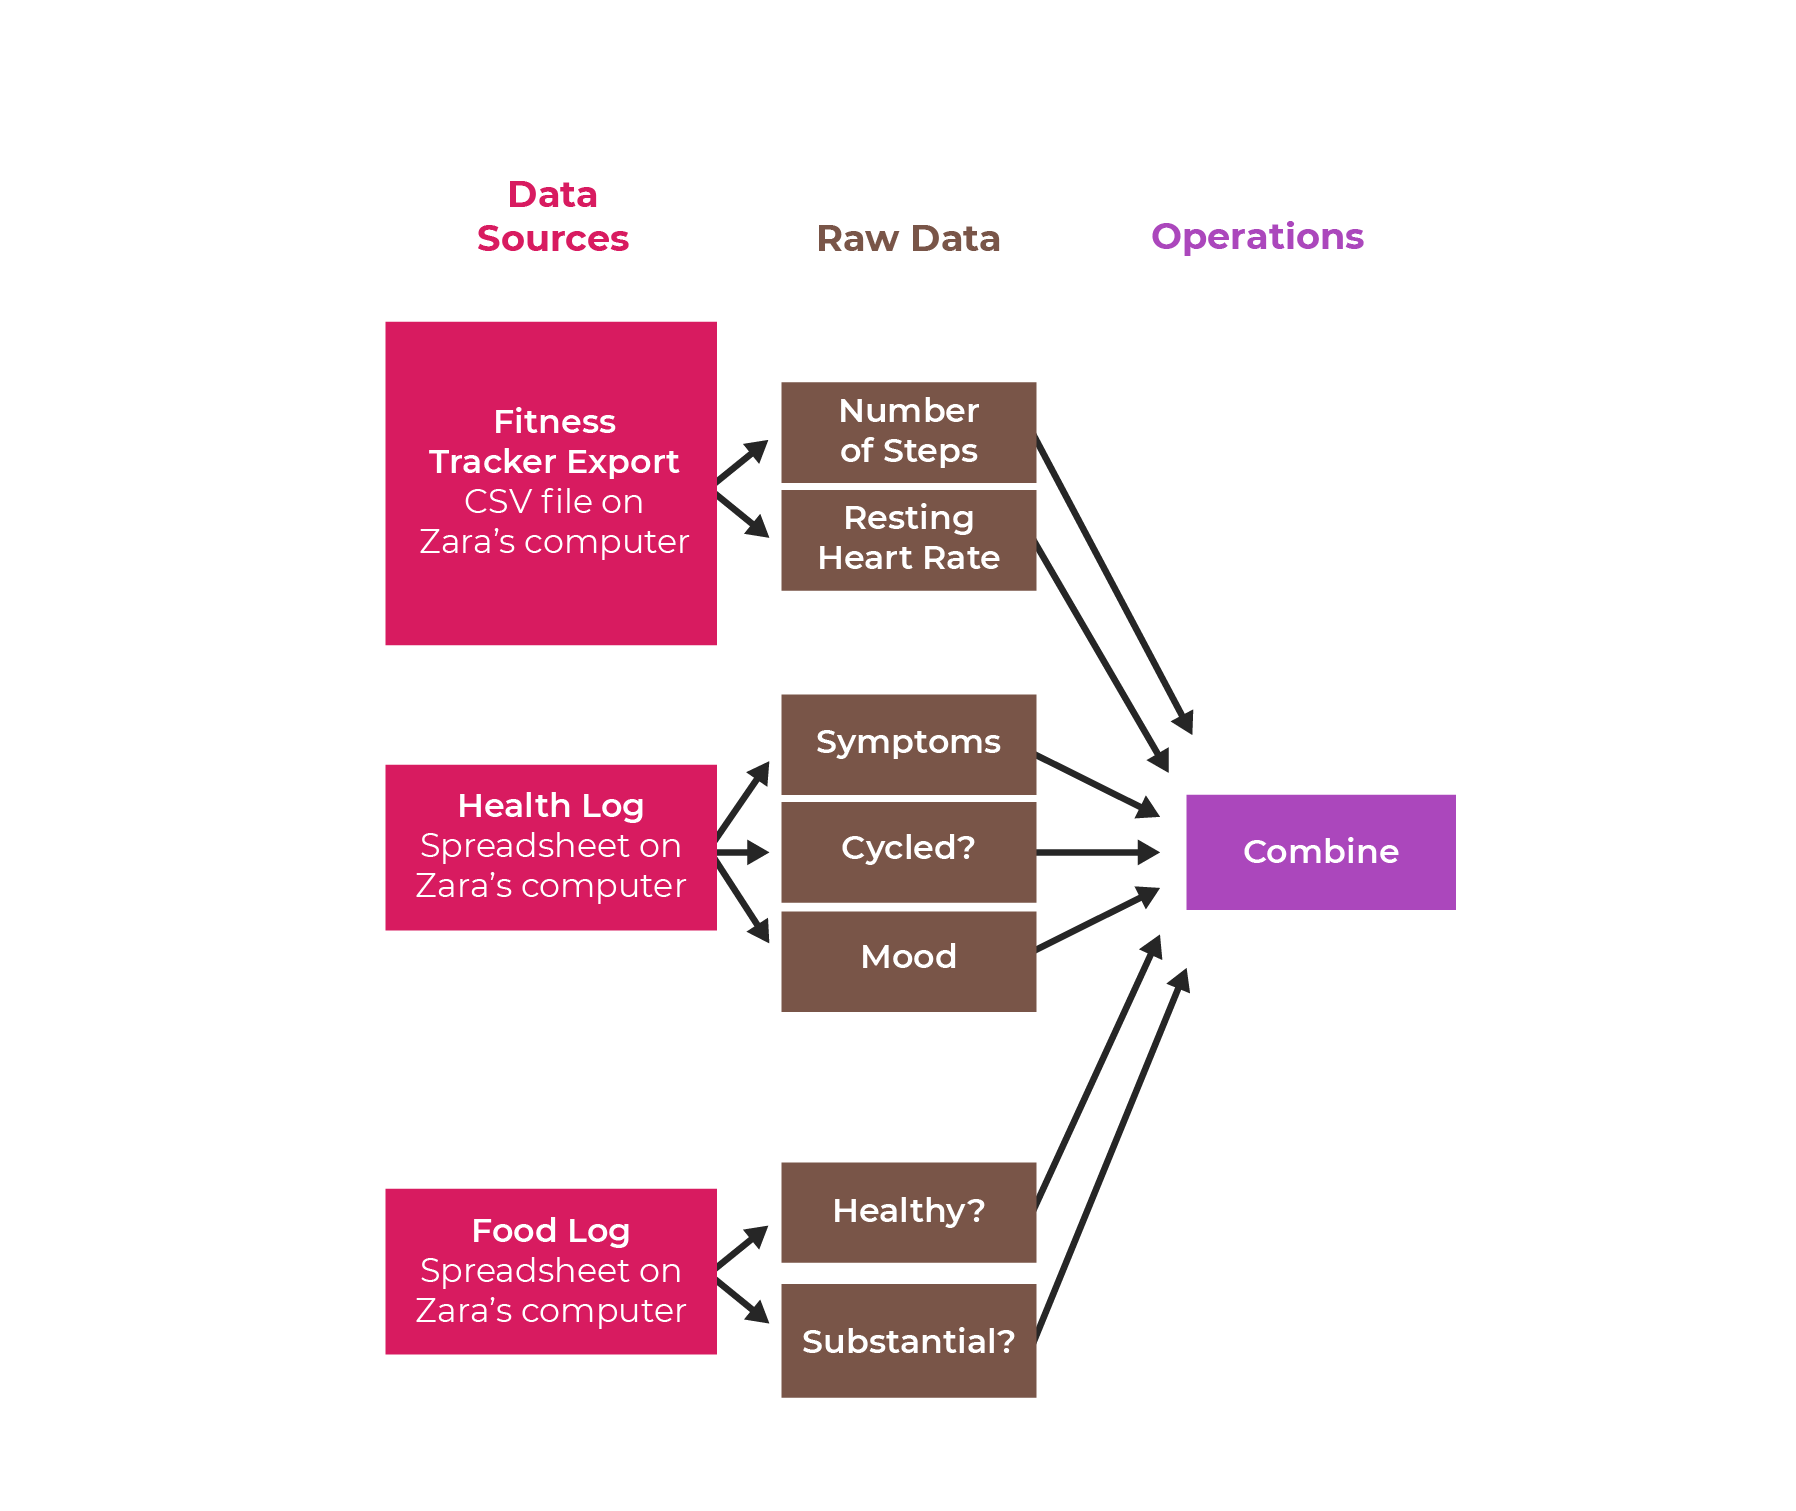
Did you sneak in another data source here?
Indeed I did! You can add it to the data pipeline diagram like this:
Let’s Recap!
Wow, that was a lot of theory! But these are important concepts. Here’s a summary of what you learned:
Data is useful when it’s both computer-processable (i.e., in .xls or .csv formats) and has information value (usually, it needs to vary to tell you something significant).
There are a lot of considerations when it comes to data! Therefore, before using it, you must be conscious of ownership and sensitivity.
Depending on where it's located, data might require gathering approaches such as filling it in manually, downloading it from a source, accessing a database, using APIs, or web scraping. But you can also create it yourself!
Structured data is organized in a standardized way and easily processable by a computer, while unstructured data is harder to process.
Great work gathering the data and finding out if it is useful! Now that you have analyzed what you’re working with, you are ready to start processing your data.
