Manipulate Data for Versatile Use
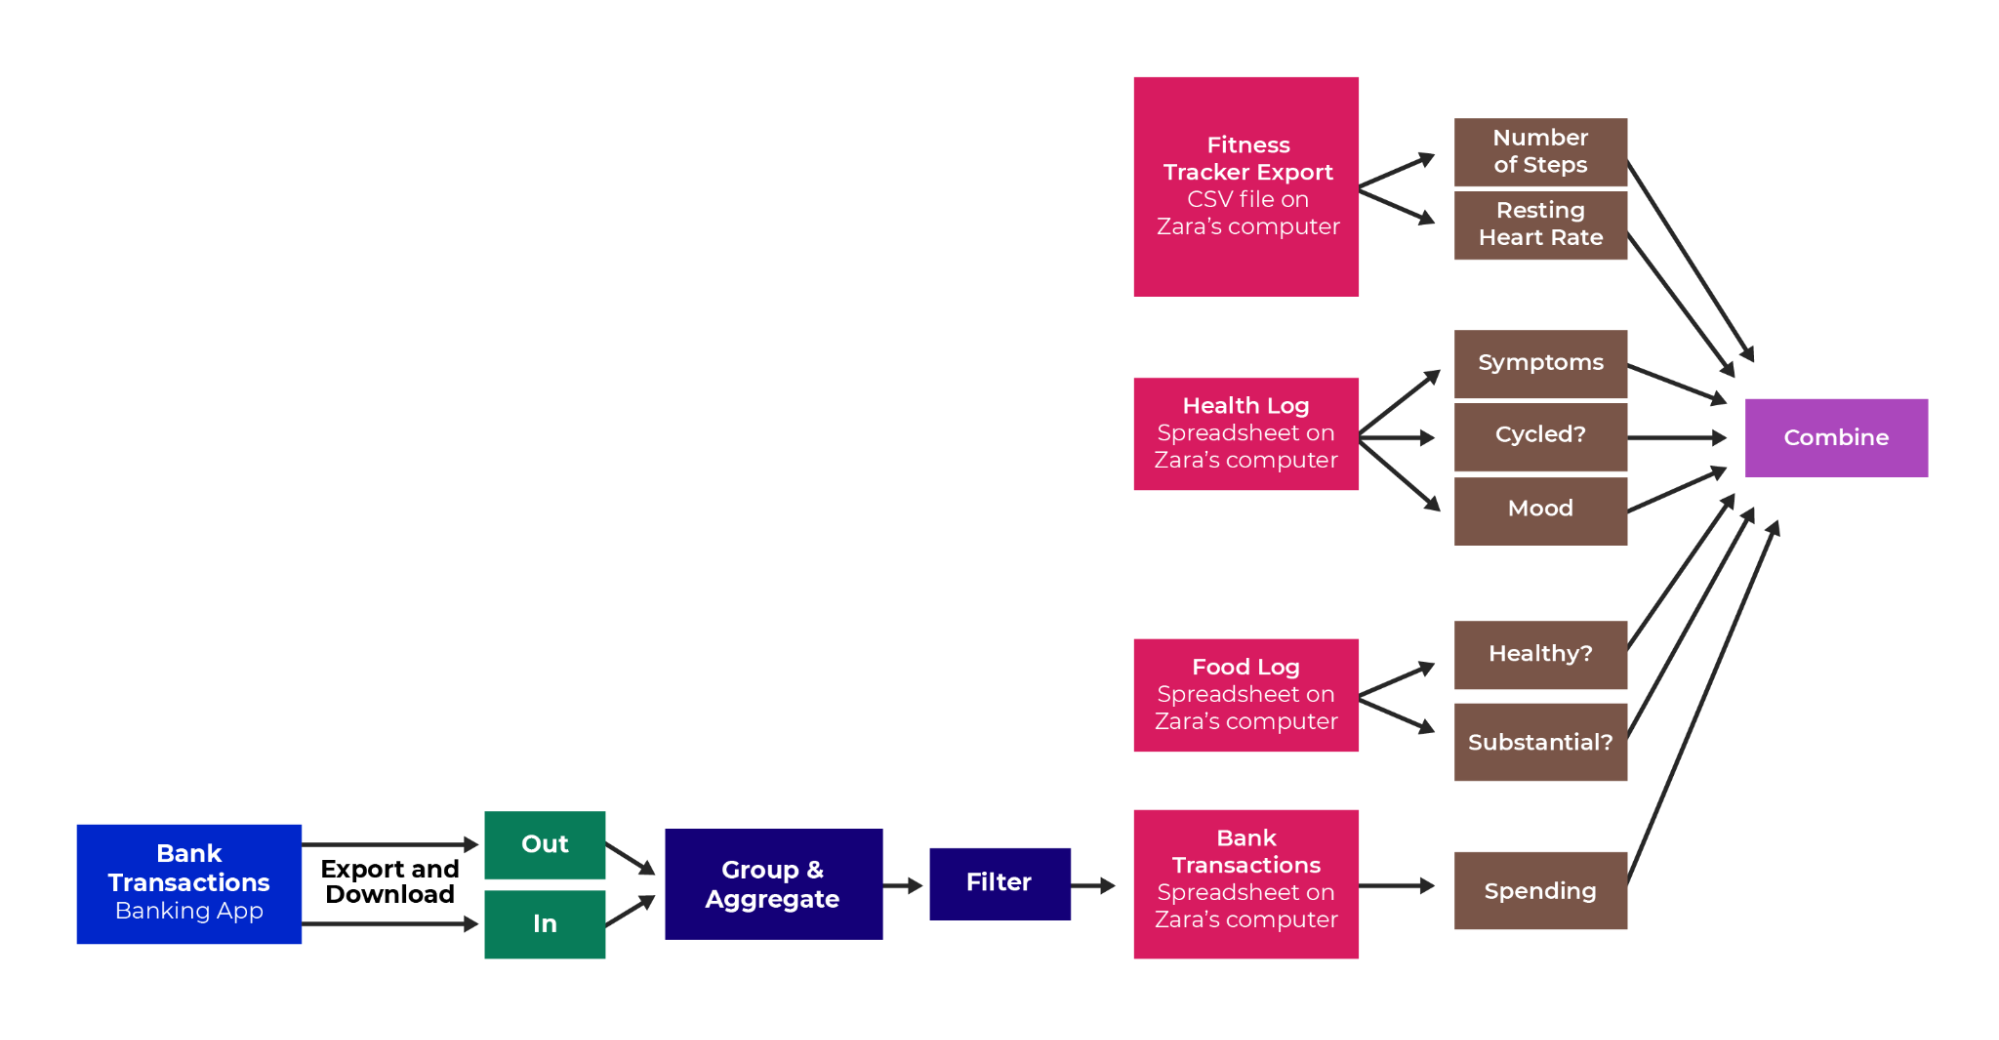
In this chapter, you will start to process Zara’s data to go through the data pipeline. Here’s a reminder of what it looked like: 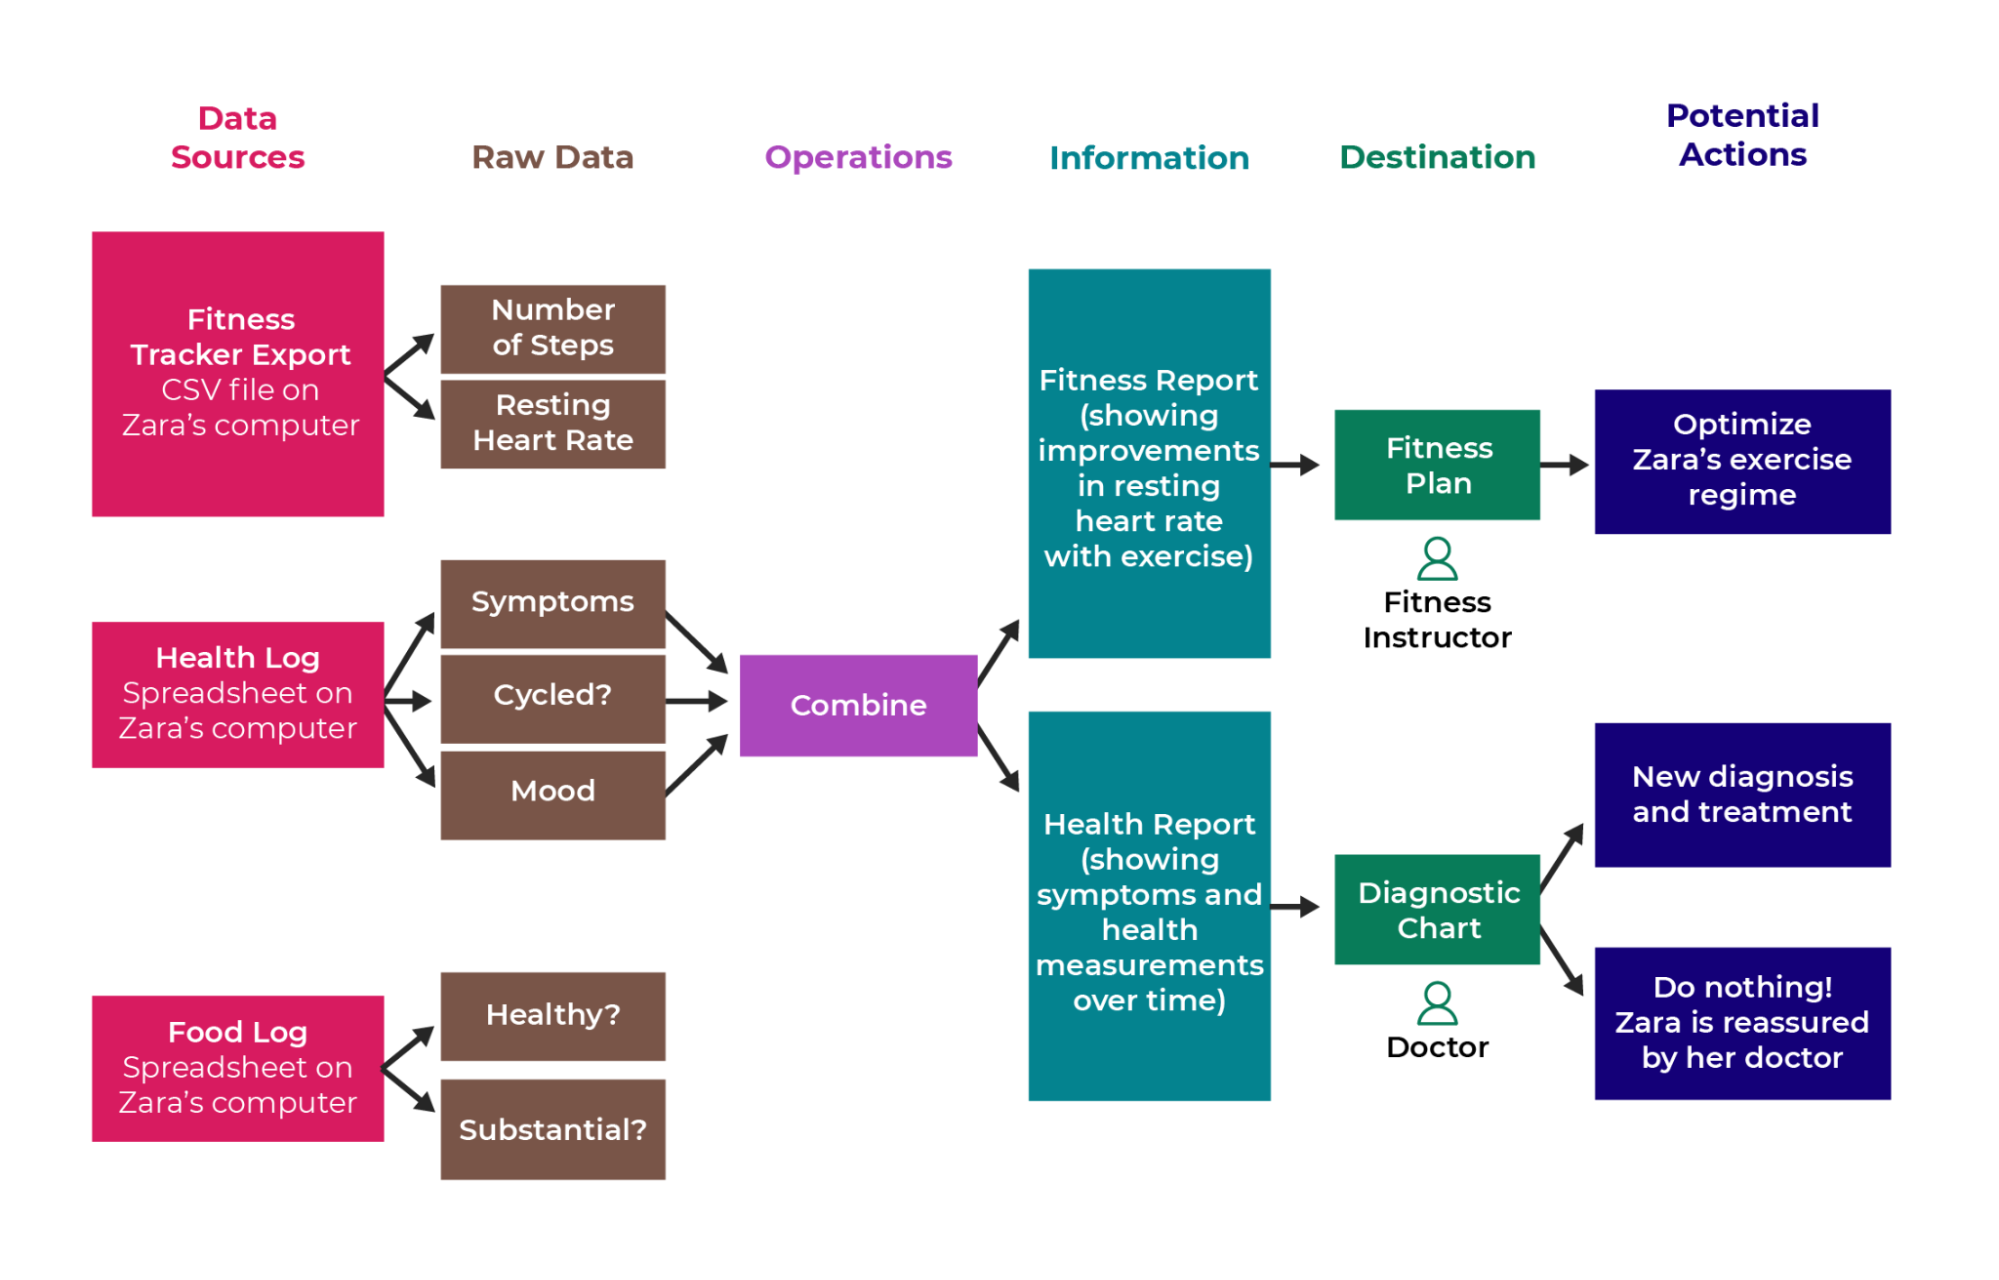
By the end of this chapter, you will create a consolidated spreadsheet, combining the data from all three sources. This spreadsheet will help you build a more complex view of Zara’s lifestyle choices, and start analyzing their impact on her health and fitness goals. In addition, Zara will provide you with some new data sources that you’ll be able to combine.
Step-by-step, you will:
combine the Fitness Tracker, Health Log, and Food Log data into a consolidated spreadsheet.
download some new data about Zara’s bank transactions.
group and aggregate the bank transactions, so you have one total transaction per day.
filter the bank transactions to just February.
clean up any issues with the data.
You will use the consolidated spreadsheet to analyze the connections between the different areas of Zara’s life that you've collected data on.
Look at Data From Different Perspectives by Combining
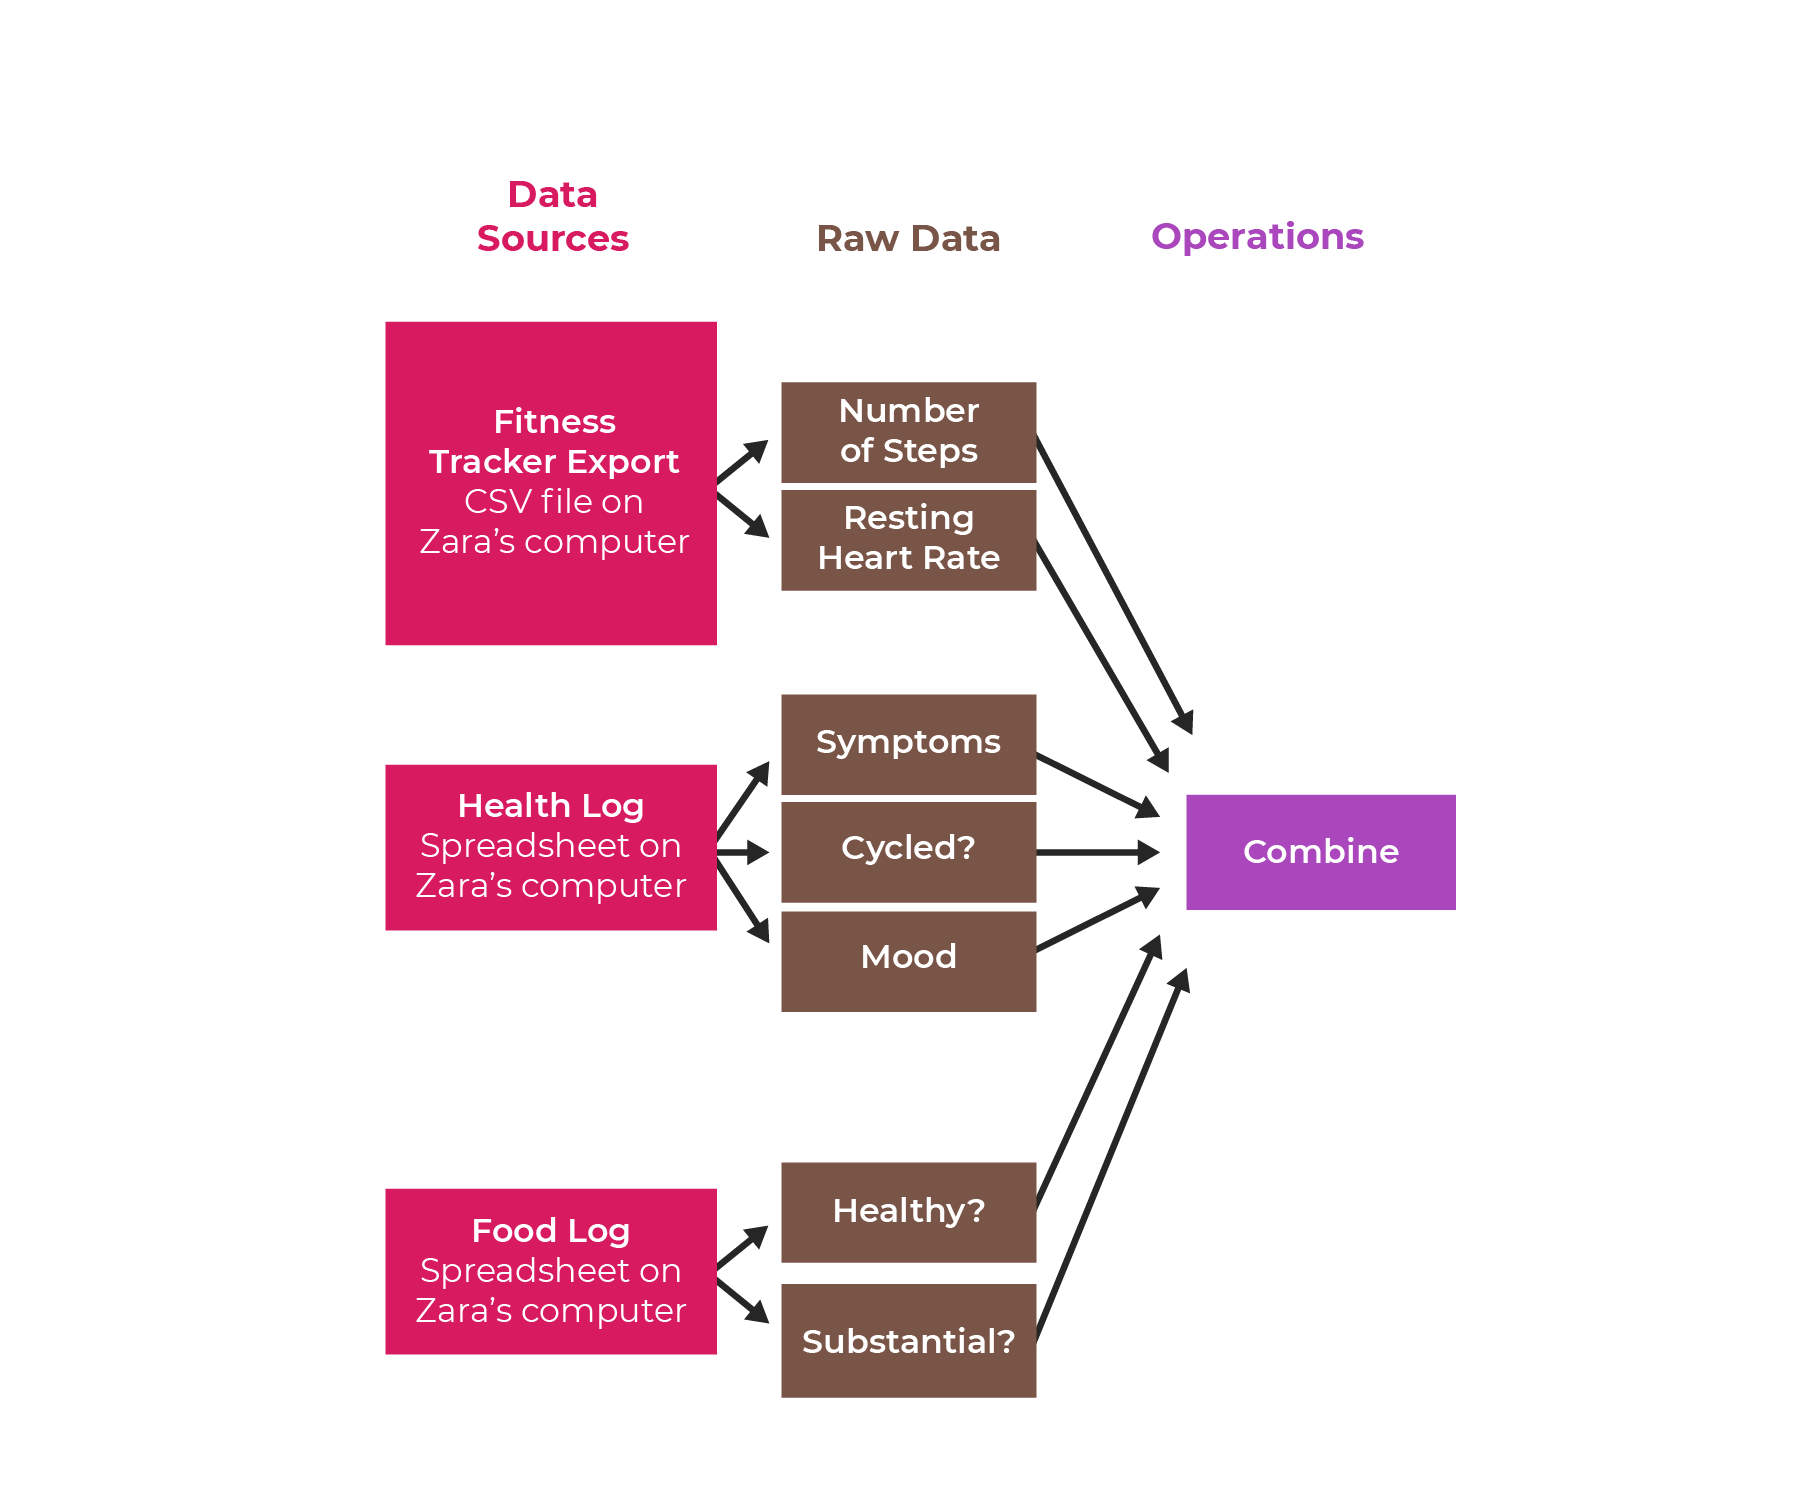
Let’s first combine the data in the Fitness Tracker, Health Log, and Food Log files:
After you've done all this, you should have a new spreadsheet that looks like this:
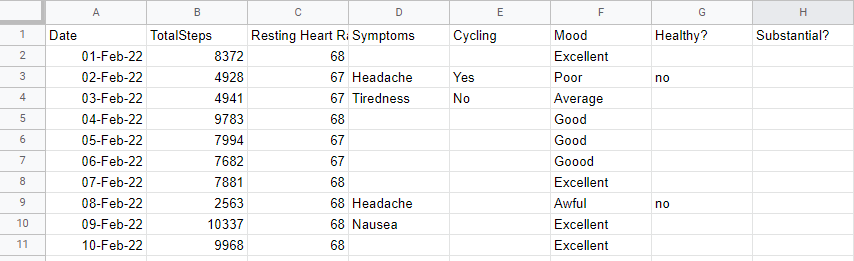
Watch this screencast to see how I merged the three data source files into a consolidated spreadsheet. Don't hesitate to follow along on your own copy of the data!
Now that you have combined the data, you can find out how all Zara’s data relate. Exactly what you need for the health and fitness reports!
Summarize Data by Grouping and Aggregating It
Next, introduce the new data source and process it by the following portion of a data pipeline:
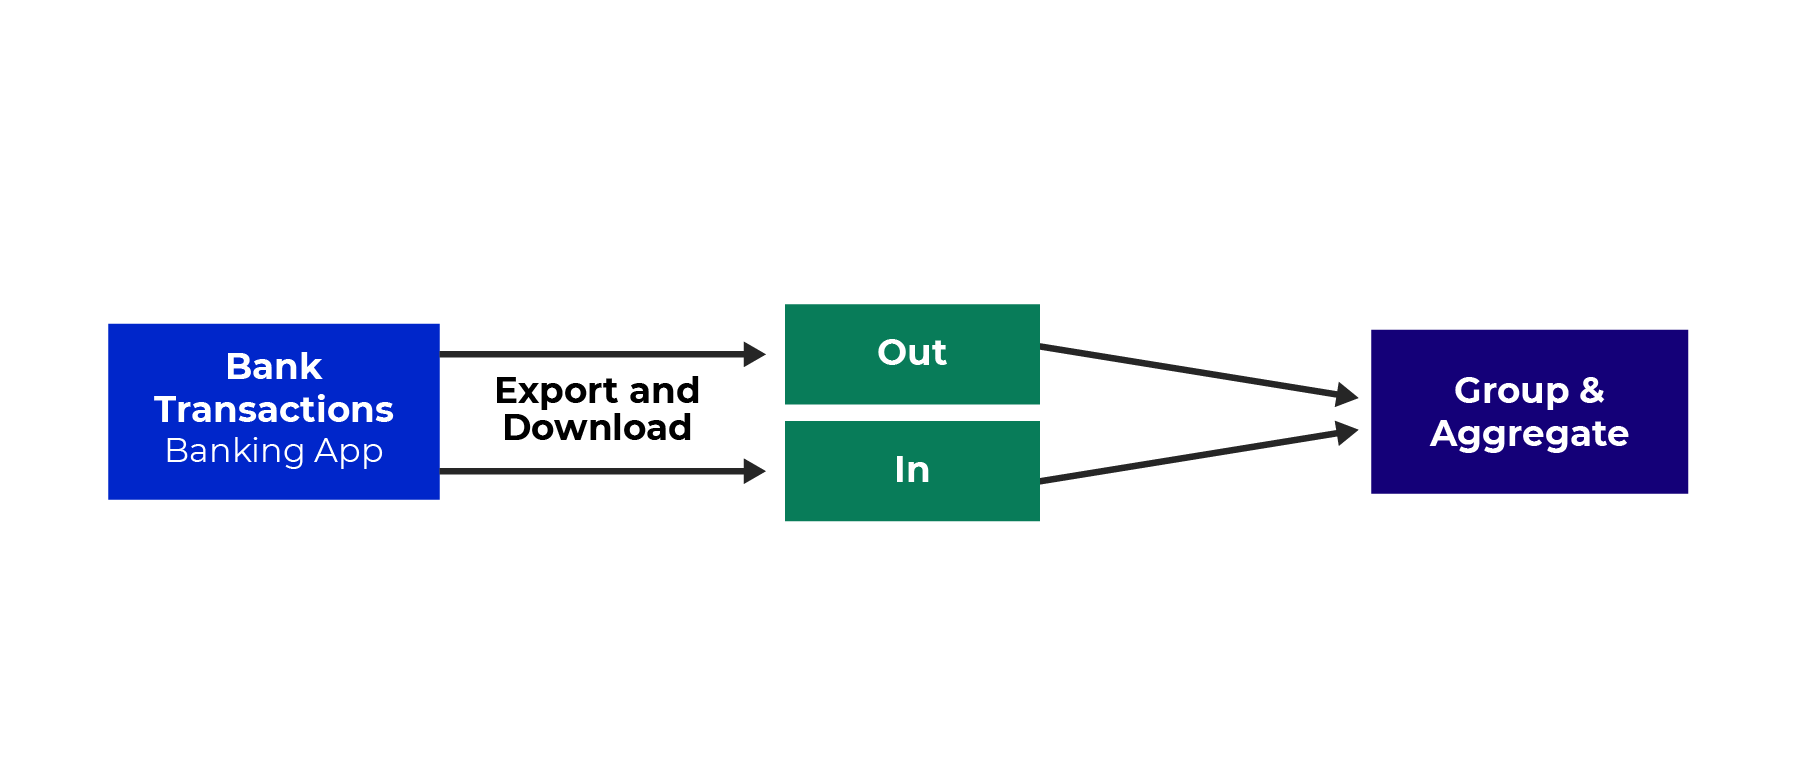 Zara likes to spend money because it lifts her mood. Her mother disagrees and thinks spending money doesn't really help. In an attempt to disprove her mother’s theory, Zara wants to collect some data about her spending habits to see if she can find a pattern linking her mood and spending. She downloads her bank transactions:
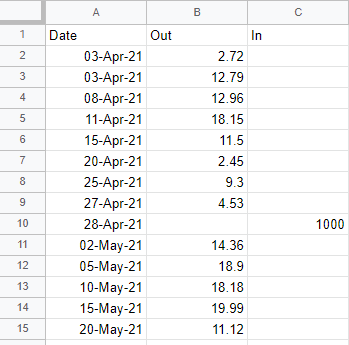
You can find this data here. When you look at it, you might notice something different from the fitness data, which had one row per date. The bank data has some dates with multiple rows and some with none. These two sets of data have different granularity.
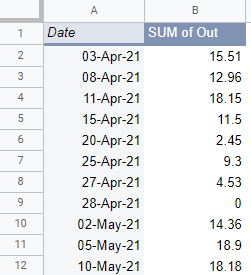
The fitness tracker granularity is day-by-day. The bank data granularity is transaction-by-transaction. Because the granularity of these two data sets is different, you can’t just combine the bank data with the fitness data like before. You first need to get the bank data to match the day-to-day granularity of the fitness data. You can do this by grouping the rows by day and aggregating the data to the day level. Take each date, find all the transactions for that date, and add them up, effectively summarizing the data to a daily total.
At the end of these manipulations, you will have aggregated the bank details, so they look like this:
Watch this screencast to see how I do this in Google Sheets and follow along. I use a feature called a pivot table. It allows you to create these sorts of aggregations and much more!
Tailor Your Data to Specific Needs by Filtering It
Next, let’s take the aggregated spending data and filter it down to just the necessary data, combining it into the consolidated spreadsheet:
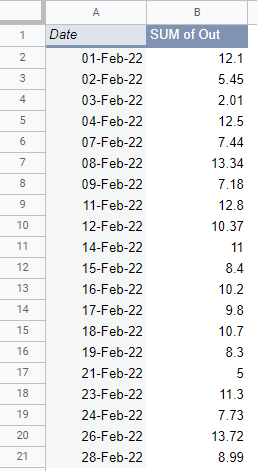
Now you have the bank data aggregated to the day level. But the bank transactions contain more data than necessary. First, you only need data for February because that’s when Zara started collecting her health and fitness data. So you can delete the rows before February. Second, she is only interested in her spending, not her income. So you can delete the unnecessary columns, in this case, the In column. Once you have done this, you will be left with just the bank details for February:
You’ve filtered the data down to just what you need.
Watch this screencast to see how I do this in Google Sheets, and follow along on your copy of the data:
Now combine the bank data with the rest in the Health and Fitness Consolidated spreadsheet. You want to end up with a consolidated spreadsheet that looks like this, with the Spending column at the end: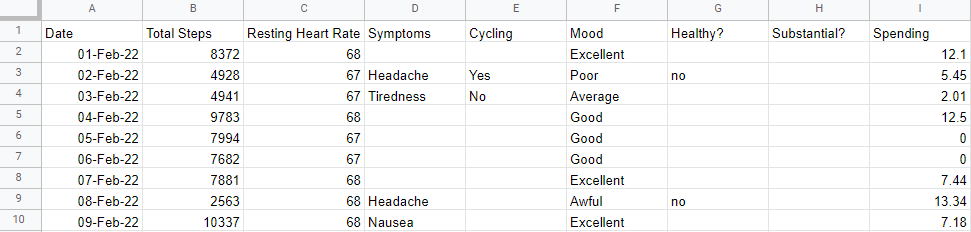
Because you don’t have the spending data for all the dates in February, you can’t just copy and paste the bank data into the consolidated spreadsheet. You could manually insert the missing rows into the bank data and then copy and paste the entire month. Or you could use a spreadsheet technique called VLOOKUP. Using VLOOKUP, you get the spreadsheet to “look up” the spending for every date in February.
Watch the screencasts below to see how I do apply these two techniques and do the same in your spreadsheet.
Combine bank data manually:
Combine bank data using VLOOKUP:
Your Turn! Clean up Data
Cleaning up your data is another step that is often necessary for data preparation. It involves correcting mistakes or issues in the data that will limit your ability to use it for your objectives. Issues might include:
incorrect data
missing values
incorrect values
Look at the data in the consolidated spreadsheet. Can you spot any of these issues? Go ahead and correct any misspellings.
Correction:
Here’s one issue in the mood column:
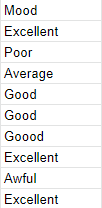
It appears that Zara was a bit heavy on the “o” key when she typed the word “Goood” here!
In addition, there are some blanks in the Symptoms and Cycling columns. You can use “None” where there were no symptoms and “No” when Zara did not cycle. It’s also helpful to have “Yes” in the Healthy? and Substantial? columns instead of blanks.
If you got this far and did everything correctly, you should have a spreadsheet called Health and Fitness Consolidated that looks like this:
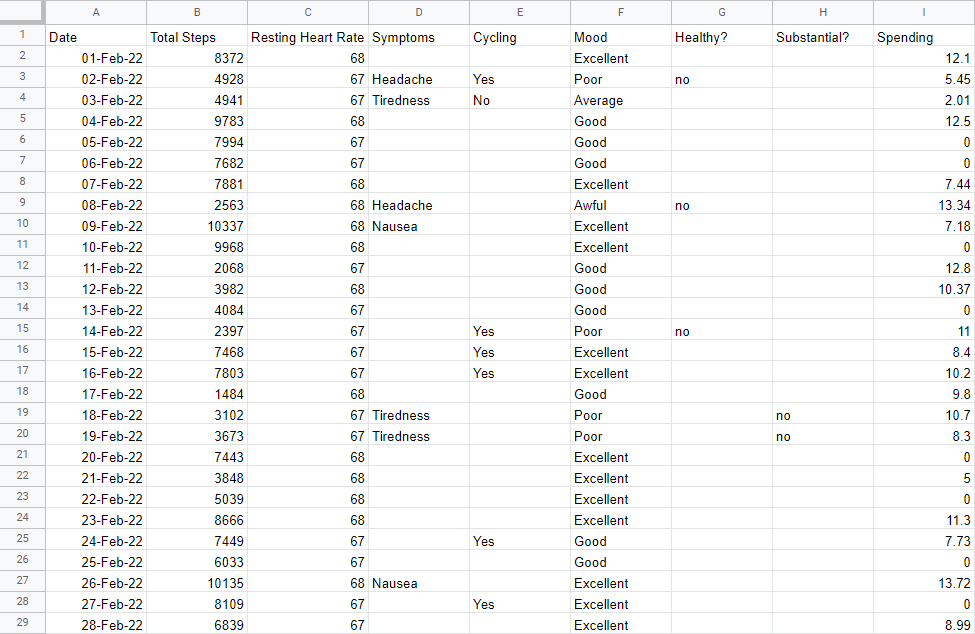
You can find my version of this spreadsheet here.
Let’s Recap!
You’ve worked hard in this chapter. Great! We covered a few important data manipulation techniques:
We combined different data sources into a single consolidated spreadsheet.
We grouped and aggregated data so that it matched the granularity of our main data sources.
We filtered data by removing some rows and columns.
We cleaned up the data by correcting issues.
By now, you have both seen and tried some key data manipulations that allow you to prepare your data for analysis. And that’s exactly what we’re going to do in the next chapter. See you there!
