Get Your Charts Right
Know the Difference Between Good and Bad Charts
You’ve seen the power charts have to bring data alive. But, with that power comes great responsibility! It’s easy for bad charts to delivering their message poorly, confuse the viewer, or even worse, mislead them. Let’s consider three ways you can use charts badly.
Choosing the Wrong Chart Type
Look at the chart comparing Zara’s guilty pleasure consumption as her mood varied:
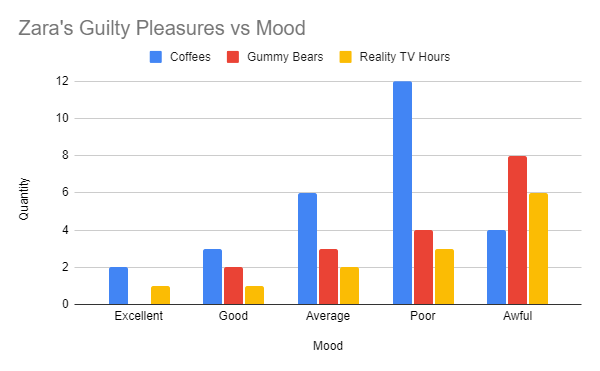
Remember that we intentionally chose the bar chart because it compares numbers effectively. However, spreadsheet programs will allow you to select almost any chart for any purpose. What if you chose to use a scatter plot:
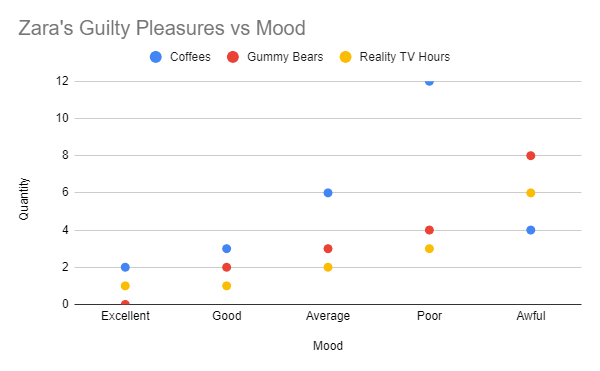
The scatter plot shows the same data and pattern, but is much less clear.
Using 3D
Some people prefer 3D charts because they look cool. However, they can be challenging to interpret. Remember that the chart’s purpose is to present the data so that patterns become apparent. Therefore, anything that makes it hard to interpret will be a problem.
Look again at the bar chart above comparing Zara’s guilty pleasure consumption as her mood varied.
Now, look at the same data plotted on a 3D chart in Excel:
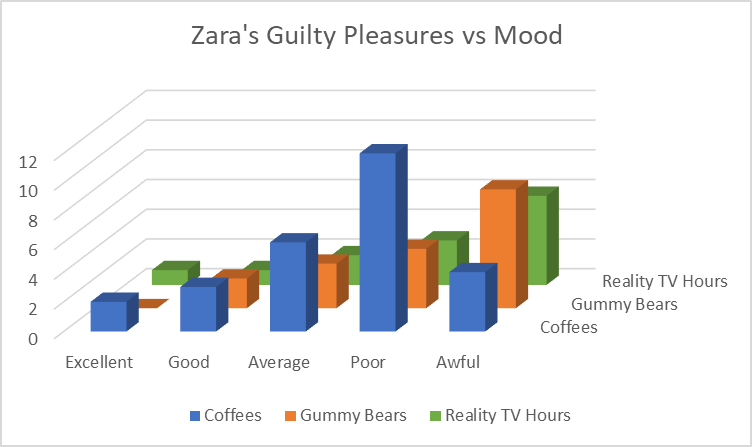
Notice how some bars are partly hidden. Also, the perspective makes it harder to compare the height of the bars.
Misleading Axis Origin
Zara and Ciaran decide to have a competition to see who can improve their running distance over a week. They record their best distance for the previous week and their new best distance at the end of the following week. Ciaran processes the data and plots two charts, which he shares with Zara:
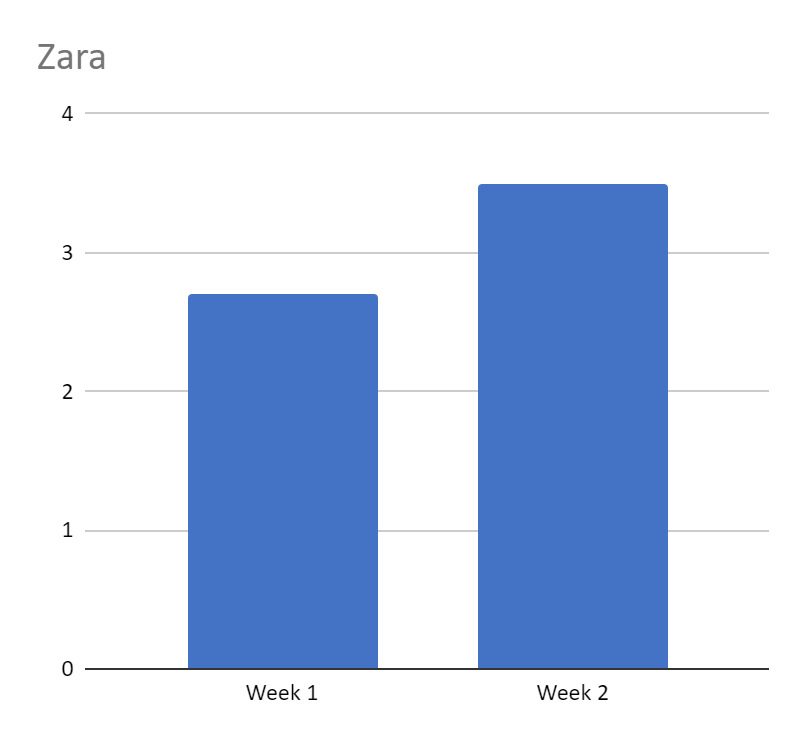
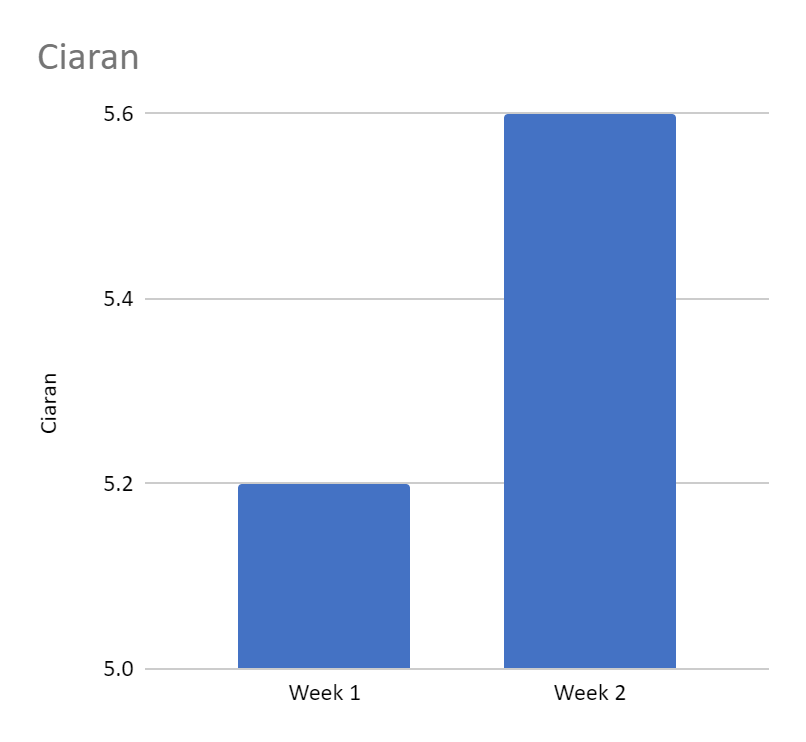
He proudly declares himself the winner. But Ciaran is being sneaky! Can you see how?
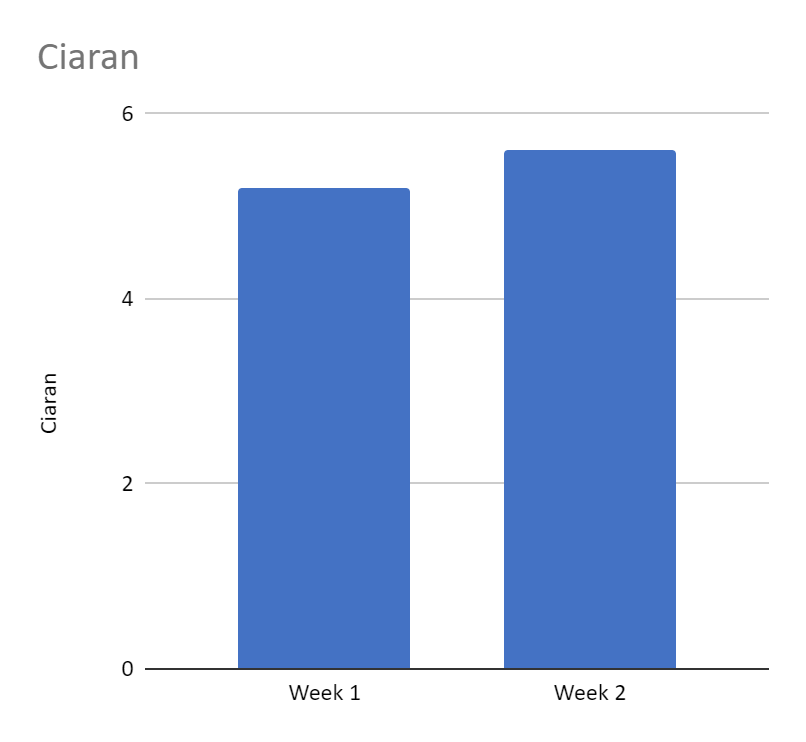
Look at the origin of the x-axis (i.e., the lowest value shown on each chart). On Zara’s chart, the base is 0, but on Ciaran’s, it is 5. This gives Ciaran’s chart a misleading impression. Zara rightly demands that Ciaran rework the chart with a 0 origin. The result shows that Ciaran’s improvement is not so impressive:
Perfecting Your Charts
As you can see, your spreadsheet tool offers several options for customizing your chart. For example, Google Sheets shows the following:
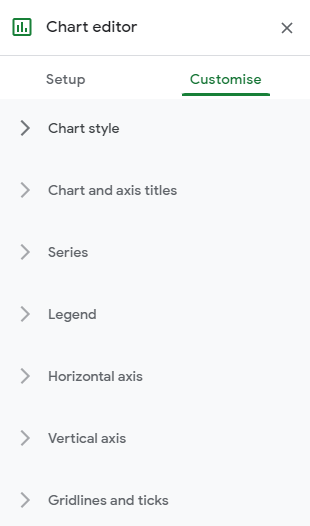
These customizations allow you to perfect your charts so that their message is clear. There is an art to getting this right, but there are a few general guidelines:
Colors
Choosing colors that look nice is a good idea, but putting thought into your selection will help guide the viewer.
You can use a progression of sequential colors to represent a natural data sequence:

If you have data with no sequence (i.e., names of things), you can use distinctive or qualitative colors:

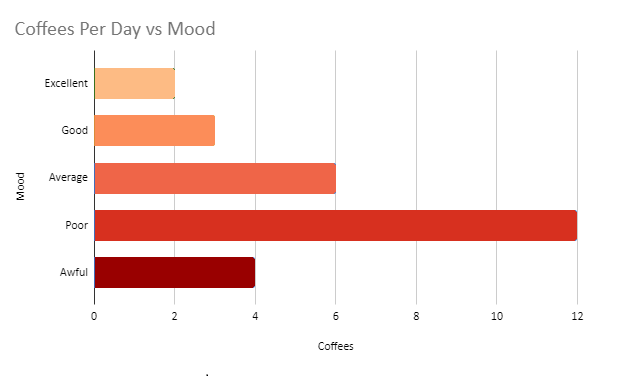
Here, Zara’s mood progresses from excellent to awful, so a progressive color sequence makes sense:
You can use a tool like ColorBrewer to help you pick appropriate color schemes.
Don’t forget to consider colorblind viewers. ColorBrewer has an option for safe colors, and there are good resources like Coloring For Colorblindness to help you.
Annotations
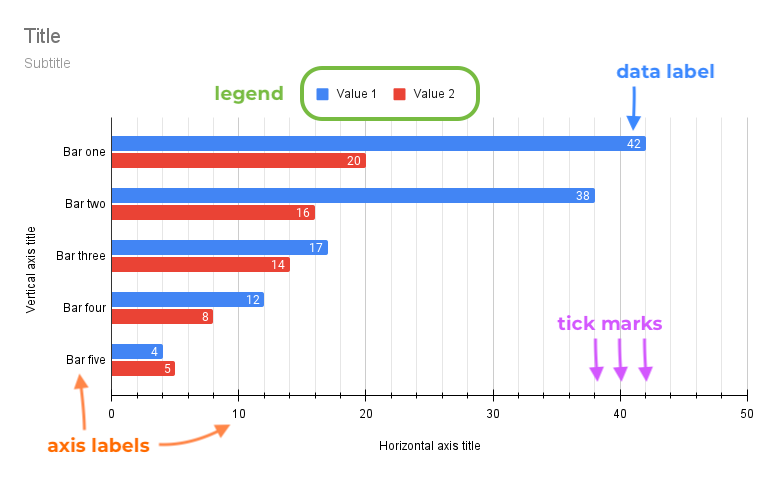
Annotations are graphical or textual adornments for your chart. They can help show a clear message; however, too many can make a chart look cluttered. Here is a chart with most of the annotations that Google Sheets allows. Carefully choose the ones to help clarify your message.
Consistency
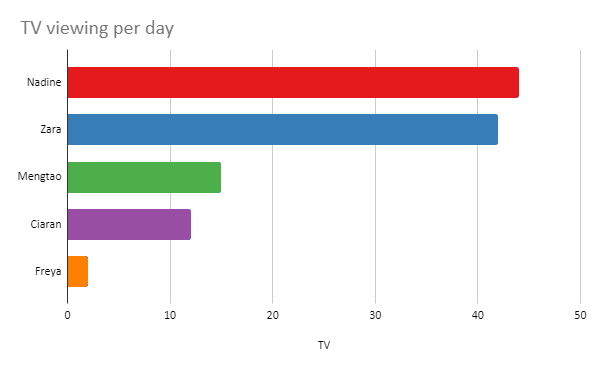
Sometimes you may find yourself creating charts for a specific purpose (i.e., building a business report). It’s a good idea to be consistent across all of them. For example, if you have a chart where Zara has a blue bar, and Nadine has a red bar, the following chart should use the same color scheme. This makes it easier for the viewer to interpret your analysis.
Choose Your Tools and Technologies
There are a huge number of different tools you can use to create visualizations. We can’t go into all of them here, but let’s review a few different types. You certainly don’t need to know how to use all of these, but it’s good to know some options.
Spreadsheets
We’ve been focusing on spreadsheets in this course, which are multi-purpose tools that allow you to create, manipulate, analyze, and visualize data. For many people, the charting features are sufficient for their purposes. The following are just a few of the popular spreadsheet tools:
Google Sheets
Microsoft Excel Online
Microsoft Excel Desktop
Apple Numbers
Specialist Data Visualization Tool
There are also tools that specifically focus on creating charts and dashboards.
Here are a few popular data visualization tools:
Tableau
PowerBI
QlikView
Looker
Google Data Studio
RAWGraphs
Programming
You may require a programming approach if you need more granular control over how a visualization looks. The learning curve for programming is very steep, but it allows you to build a visualization exactly the way you want it. Here are some tools that require programming skills:
R
D3 (JavaScript).
Matplotlib (Python)
Plotly (Python)
Vega-Lite
Let’s Recap!
It’s worth spending some time finding the right tool to refine your data visualization task effectively. Be careful to avoid common mistakes with charts.
Common pitfalls include:
Choosing the wrong chart type.
Inappropriate use of 3D.
Setting a misleading x-axis origin.
You can refine your charts using:
the right color palettes (sequential vs. qualitative).
suitable annotations.
There are many available data visualization tools, either in spreadsheet programs, specialist data visualization tools, or programming languages.
Well done! You reached the end of this part of the course. By now, you know how to visualize your data clearly and meaningfully. In the next part, we will pull together all the insights we’ve gathered from Zara’s data and create her data story.
