Work With Data in the Real World
Be Critical of Yourself and Others
As you move your work with data into the real world, you need to be aware of some considerations.
You’ve already seen that the ability to work with, analyze, and tell stories with data is very powerful. But with great power comes great responsibility! Unfortunately, there are many cases of data being used irresponsibly, either through carelessness or malice. As you become more skilled at working with data, you should become more proficient at spotting these bad practices.
Even more importantly, don’t fall into bad habits! Practice good data ethics by following the advice below:
Explain Your Process
As you saw in this course, the final data story is just the end result of a process that can involve several steps: filtering data, combining it, modifying it, aggregating, analyzing, etc. This processing can significantly influence the message you convey in the end. A different set of processing steps could result in a very different message. Try to be transparent about your process so the viewer can make their own judgments. You don’t have to list all the steps with your final published story, but you could provide some details in supporting documentation or at least be prepared to elaborate on your techniques if challenged.
Explain Your Calculations
If you’ve computed a statistic, be clear on how you calculated it. If one politician said, “We’ve put 500 more police on the streets,” and the opposition says, “No, there are 600 fewer,” they could both be right! It depends on how they calculated the numbers. One could measure the number of individuals employed as police officers, including part-time police, and the other may measure the total full-time officers.
Acknowledge Other Viewpoints
Real-world data analysis is not like this. The same data can be used to draw very different conclusions. The responsible and mature approach is to acknowledge this and draw attention to different interpretations and conclusions.
For example, you might do a taste test on 10 different brands of vanilla ice cream using 50 tasters and declare that Happy Hippo’s Vanilla Ice Cream is the best. But your analysis was based on taste. Maybe for someone else, “best” means “best value,” and Happy Hippo’s very expensive range is not the best. Or, “best” could mean something else entirely to yet another person!
Cite Sources and Helpers
It’s rare for someone to work with data in isolation. It usually has been sourced from somewhere, and other people have been involved in the analysis. So make sure you cite your data source(s) and who else was involved in your work.
Avoid Misleading and Sensationalizing
When working on a data story, it can be tempting to bend the truth or sensationalize it to make it exciting or align with your goals. Try to avoid this. You need to make an impact and sometimes a small dose of “appealing to emotions” to convey your message, but there is a fine line to be walked here.
Also, be careful about implying that the data indicates something when you are just stating your own beliefs or interpretations.
Avoid Unknown Biases in Your Data
Bias occurs when data doesn’t reflect what is actually happening in the real world. In that case, any conclusions drawn can be flawed. Bias in data is a huge problem, and unless you are aware of the potential sources of bias, you run the risk of presenting misleading results. Here are just three examples.
Selection Bias
Imagine you want to find out if people in a particular town want more sports facilities. So you visit the local sports center and ask the people coming out, “Would you like more sports facilities in town?” You will probably find that this group is more likely than the average citizen to want more sports facilities! So your survey would be biased.
Confirmation Bias
Have you ever come across a theory that a certain animal is dangerous (i.e., hedgehogs) and started researching? You find evidence to support this theory, which builds over time to become an overwhelming case. This is confirmation bias. It’s the tendency for people to look for evidence to support their beliefs.
(I have no idea if hedgehogs are dangerous, but I bet I could prove it through some selective research!)
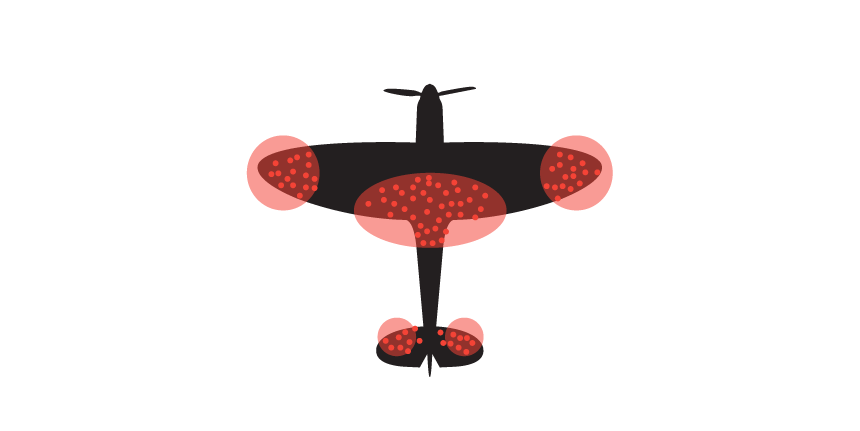
Survivorship Bias
In the video, you saw a classic example of survivorship bias from World War II. The planes returning from combat had to be reinforced. Rather than focus on the areas that were hit, the statistician, Abraham Wald, challenged the dominant strategy. First, he had them consider the planes that did not return and where they were struck. Then they reinforced those areas on the returning planes.
Ensure Your Data Set Is Big Enough
Imagine you are a scientist researching the effect of a drug on treating a disease. You test it on five people and find that three of them recover. Do you declare that the drug is 60% effective? Of course not! The data set is too small. You need to test it on many more people before you can start drawing conclusions. Make sure that any data set you use for research is big enough.
How big is big enough?
It depends on what you are trying to accomplish, but consider that your data set is a sample that represents a larger group of data points (called a population). You can use various data sampling techniques to ensure your sample represents your population. You will encounter this subject more if you continue studying and working with data.
Avoid Cherry Picking
Consider this chart showing the average earnings for the top 10% of earners vs. the rest of the population.
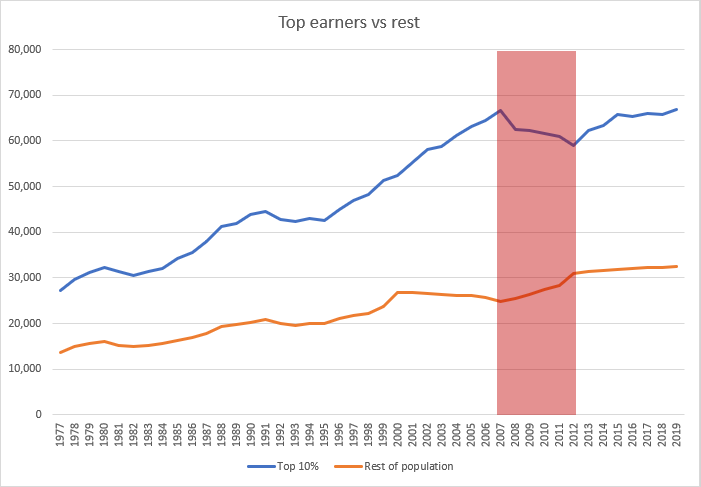
Overall, you can see that everyone’s earnings are increasing. However, suppose someone were to just focus on the red highlighted area. They could state that the top earners’ salaries are falling while the rest of the population’s earnings are increasing.
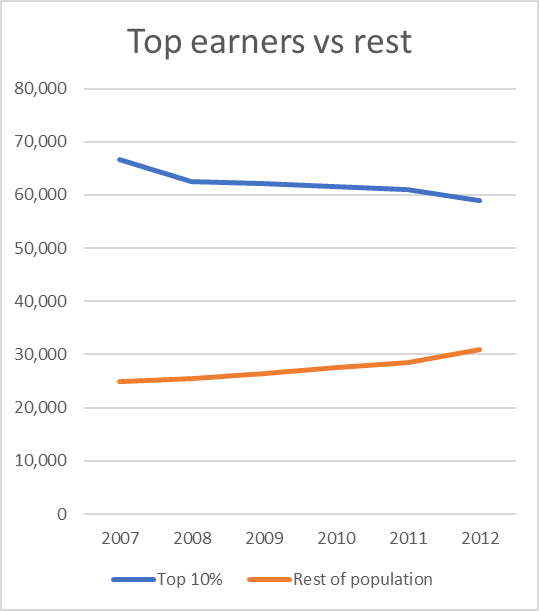
This misleading practice is called cherry picking (i.e., selectively isolating and presenting data that fit with the desired story).
Declare Known Data Issues and Assumptions
Sometimes you have to work with flawed (i.e., biased) data. This doesn’t mean you shouldn't publish your data story. However, when sharing it, you should declare its limitations so the audience can make informed decisions.
Watch for Unwanted Behavioral Changes
In part 1, chapter 3, you saw how the GardenFresh drivers might develop unwanted behaviors to meet their targets and get bonuses.
This phenomenon is called the Hawthorne effect. In part, you want behavioral change when you start measuring things and gathering. But beware of unexpected and unwanted behaviors!
Be Careful When Presenting Percentages
One pitfall is applying percentages to low numbers. For example, if a patient heard that a particular new treatment increased their chances of a serious side effect by 100%, they might be worried. However, the reality may be that the case is only 1 in a million with the original drug and 1 in 2 million with the new treatment. That’s still a 100% increase, but so small that it’s hardly worth worrying about.
Let’s Recap!
In this chapter, you saw what it takes to work with data in the real world ethically:
Ask the right questions about data that you read and communicate.
Explain the process that led you to your data story.
Explain your calculations (and be careful with percentages!).
Acknowledge other viewpoints: data doesn’t always equal hard facts.
Don’t forget to credit your sources and collaborators.
Avoid bending the truth about what your data indicates and cherry picking data that aligns with your story.
Watch for hidden biases in your data and unwanted behavioral changes in others.
Final Words
Well done! You reached the end of the course. It was a pleasure to accompany you on this journey. You should be proud of yourself, as you have discovered and put into practice many complex subjects, such as data pipelines, data processing and analysis, data visualization, data storytelling, and much more. You are now well-equipped to dive deeper into one or multiple data science subjects if you wish to. But most importantly, you can derive meaning from the data you interact with and interpret it critically. And that is the essence of being data literate!
I hope this course has increased your desire to explore the fascinating and increasingly important world of data further.
