Set up Your IDE for Debugging
We’re now going to explore the debugging features of two IDEs, Visual Studio Code and PyCharm. You can choose whichever of these you prefer. Just go to the corresponding section in your IDE.
Make Full Use of Visual Studio Code
According to the 2019 Stack Overflow Developer Survey, Visual Studio Code is the most popular IDE. It’s also the favorite of many Python developers. One of the main reasons is its extensibility, which allows you to install extensions for various programming languages. In our case, the debugging features. Let’s take a look at them now!
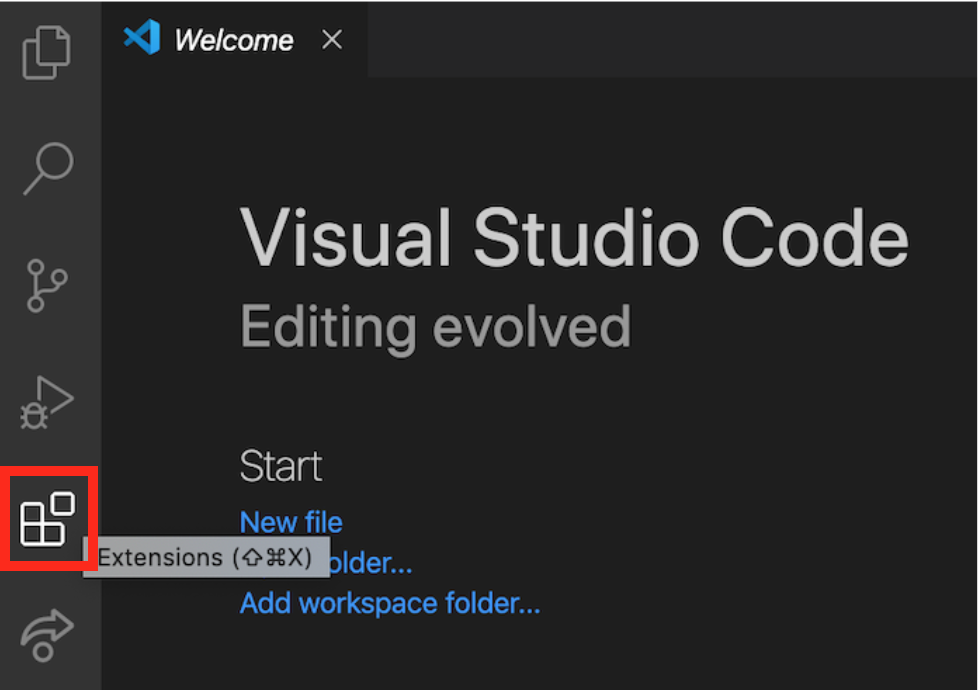
Open Visual Studio Code. In the menu on the left, click on the “Extensions” button.
Let’s install the Python extension in Visual Studio Code. To do this, click on the extension zone on the left and look for “Python.” It’s the extension “Python extension for Visual Studio” created by Microsoft. You can’t miss it—it’s been downloaded more than 36 million times!
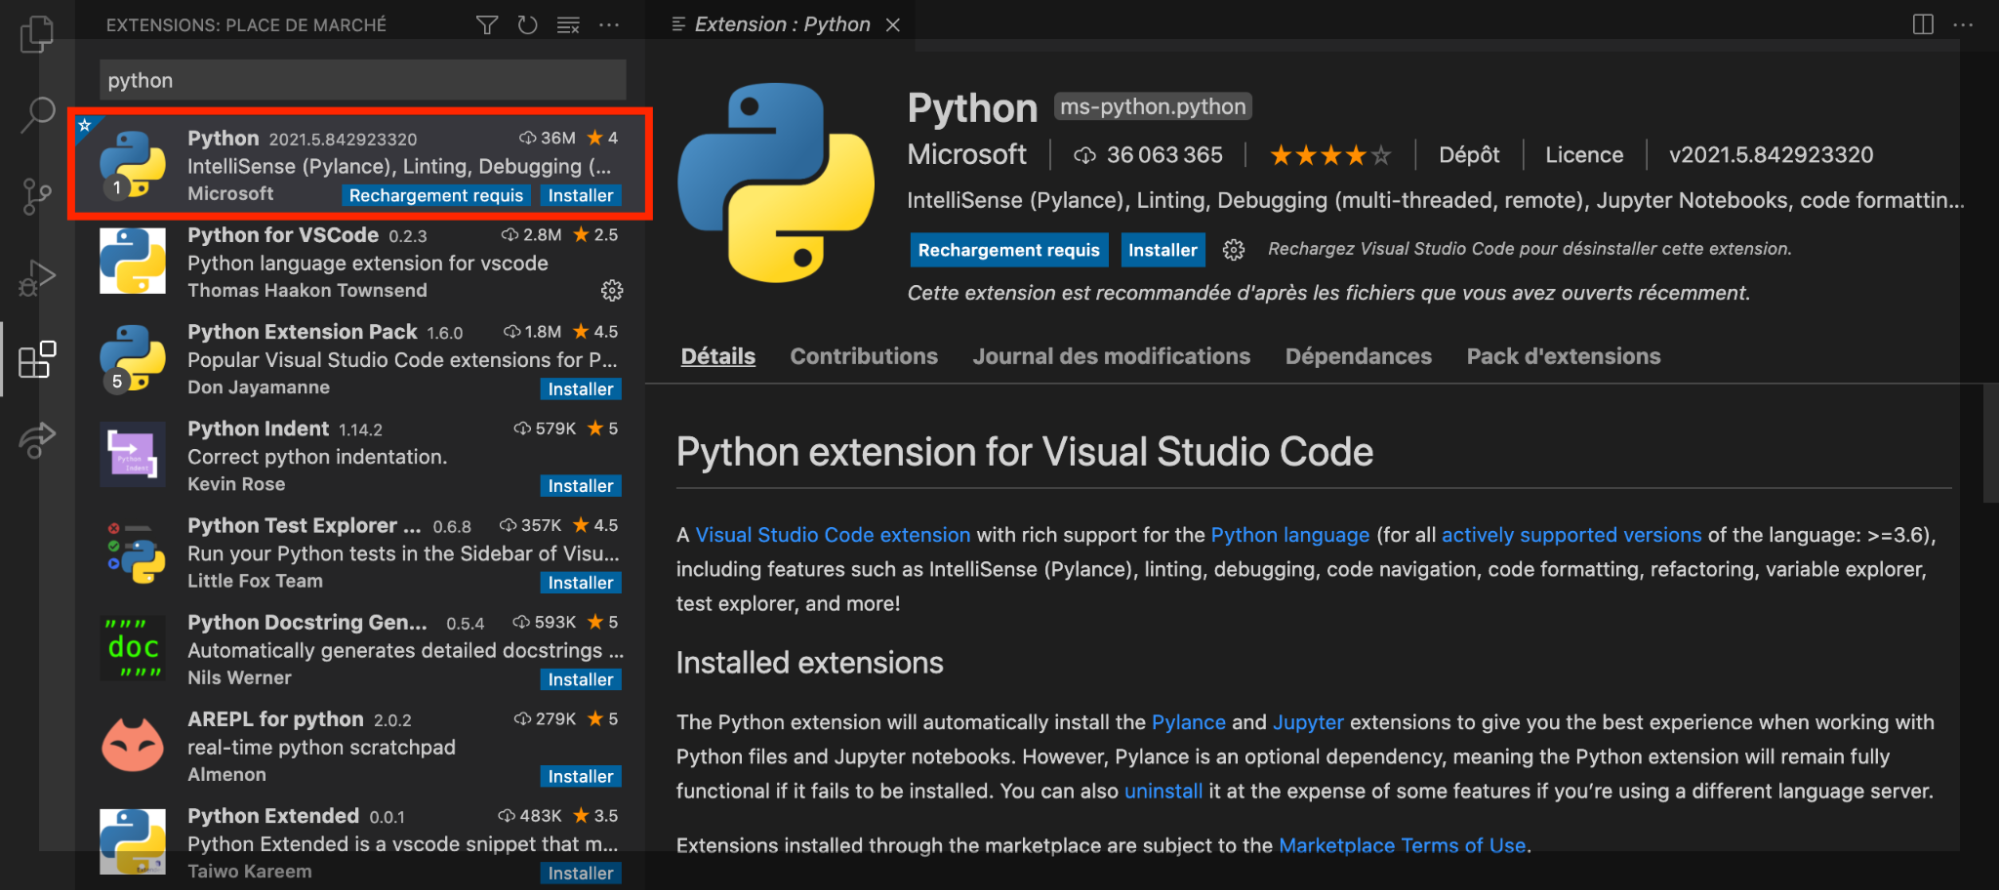
As you can see, this extension contains a linter, a debugger, and many other helpful tools.
Finally, select the Visual Studio Code Python interpreter. To do this, click “View,” then “Command Palette.” Next, type in “Python select” and choose “Python: Select Interpreter.”
Depending on how many versions of Python you have on your computer, you might have several different interpreters. I recommend choosing a recent and stable one.
Now you have everything you need to debug your Python projects with Visual Studio!
Track Down Bugs in Visual Studio Code
In the following screencast, you’ll see the debugging features in Visual Studio Code to track down bugs in our tkinter project. After that, you’re going to use the linter, create a launch.json file, and explore debug mode. Ready to find out how?
You just saw that Visual Studio Code has several handy debugging features. We modified the launch.json file so debug mode doesn’t stop at every instruction. Make sure you read the information provided by the linter carefully—this will help you avoid many bugs!
Now let’s look at how to create breakpoints, conditional breakpoints, and logpoints:
Make Full Use of PyCharm
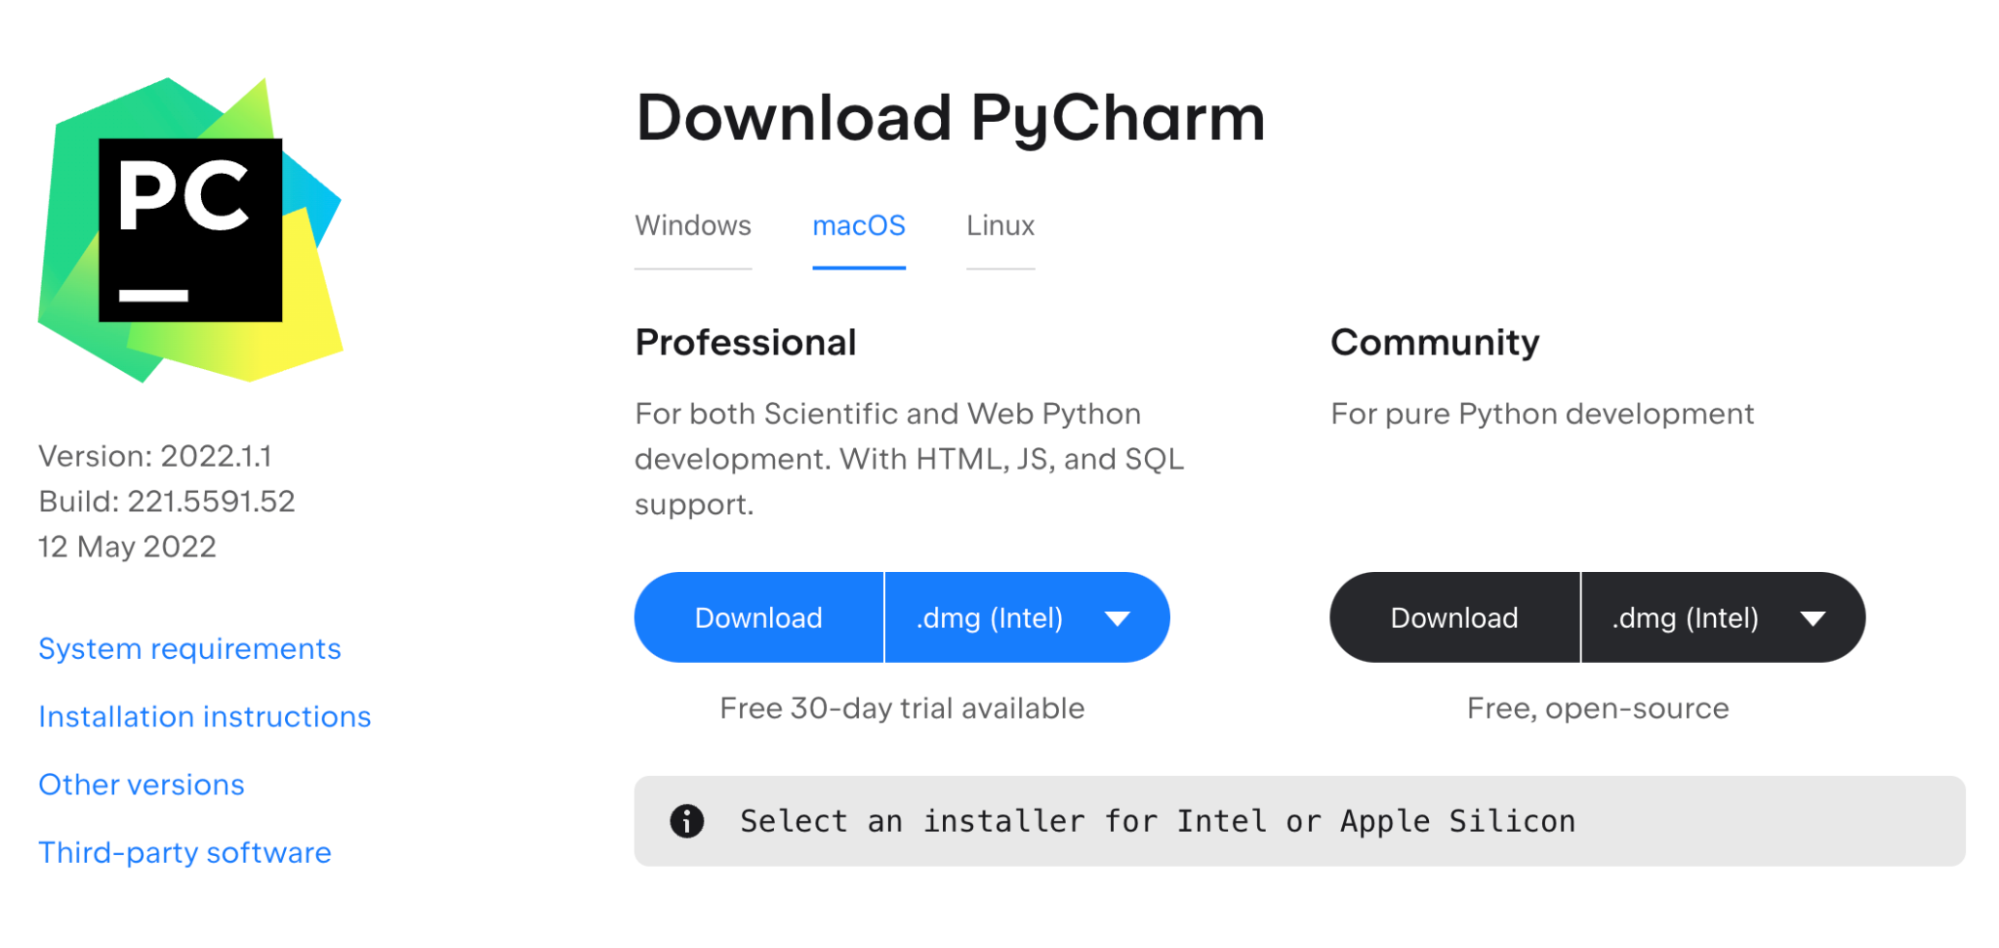
Unlike Visual Studio Code, PyCharm was created and designed exclusively for Python programming. In other words, you don’t need to install extensions to integrate Python into the IDE. With PyCharm, you can also work with Jupyter Notebooks, on web projects, or using virtualization tools such as Docker. But that’s enough theory—let’s try it out!
Track Down Bugs in PyCharm
In the following screencast, you’ll see the debugging features in PyCharm, how to use the debug mode, and create simple breakpoints.
Now watch how to create conditional breakpoints and logpoints with PyCharm:
As you just saw, PyCharm offers more or less the same features as Visual Studio Code for debugging. You also saw how to use the debug mode to create simple and conditional breakpoints and logpoints, and a linter to anticipate bugs before they occur and pose a problem. Make sure you take the time to read everything PyCharm tells you.
Bonus: Track down Bugs in Jupyter Notebook
Jupyter Notebooks are a data analyst’s best friend (and a data scientist’s too)! It’s a program for writing code and text in cells.
To learn more, check out the course Use Python Libraries for Data Science.
Find out how to debug with Jupyter Notebook in the screencast below:
In this screencast, you saw how magic commands work. For example, I changed some details of the information returned by the stack traces with the magic command %xmode and launched pdb using the magic commands %debug and %pdb on or %pdb off.
Let’s Recap!
Visual Studio Code is a very popular IDE with various options for detecting Python bugs. You’ll need to install the required extensions for it to work.
PyCharm is an IDE specially created for Python. It has several native debugging features.
You can also use Jupyter Notebook to debug programs, like IDEs using magic commands to launch pdb.
Our environments are now set up for debugging Python software programs! But wait… what about web projects? How do you debug errors inside a web framework? 🤔 In the next chapter, you’ll learn about the most common mistakes in Django and Flask projects. When you’re ready, join me in the next chapter!
