Measure Your Code Coverage

Code coverage tells us what percentage of our code has been covered by our testing. It’s a really useful measure that can help you to assess the quality of your testing.
It gives us an idea of which parts of our project remain untested.
Good code coverage, i.e., greater than 80%, indicates that a project has been properly tested and that it should be easier to add new features.
Check Your Code Coverage
Code coverage tools use one or more criteria to determine which lines of code have been checked when your suite of testing has been run.
There are five ways of measuring code coverage:
Line coverage. This is the method that is most commonly used in code coverage tools. It counts the number of lines that have been tested.
Instruction coverage. While this method could be easily confused with line coverage, it’s slightly different. It can separate out all of the instructions contained within one line and check that all of them are tested.
Branch coverage. This method counts the number of control structures that have been run. For example, an
ifcondition is one control structure, whereasifandelsecount as two branches. This measure checks that all of the options within the code have been considered.Condition coverage. Unlike branch coverage, this measure considers all boolean sub-expressions.
Function coverage. In this case, we count the number of functions or methods that have been called within the code. However, this measure doesn’t consider the number of lines within the function.
How can we find out the coverage rate for our project?
Don’t worry, we’re not going to go through our code line by line to list what is being tested. The Python library, Coverage.py , will do this for you!
Start off by installing the library by entering pip install coverage then pip install pytest-cov on your terminal.
Then run the following command on the terminal: pytest --cov=source_code_directory .
You need to specify where your source code is in the --cov option when running this command, so that Pytest can calculate code coverage based on the source files.
Measure Code Coverage on a Django Project
To give you an example, we’ll take our OC-Commerce Django project and measure the code coverage. To do this, I’m going to run the following command in the project root: pytest --cov=. .
You probably noticed the period . used in the --cov option. It indicates to Pytest that it needs to consider all source code in the current directory when calculating code coverage.
Here’s the result of running the command—we get a coverage report telling us the line coverage percentage for each source file:
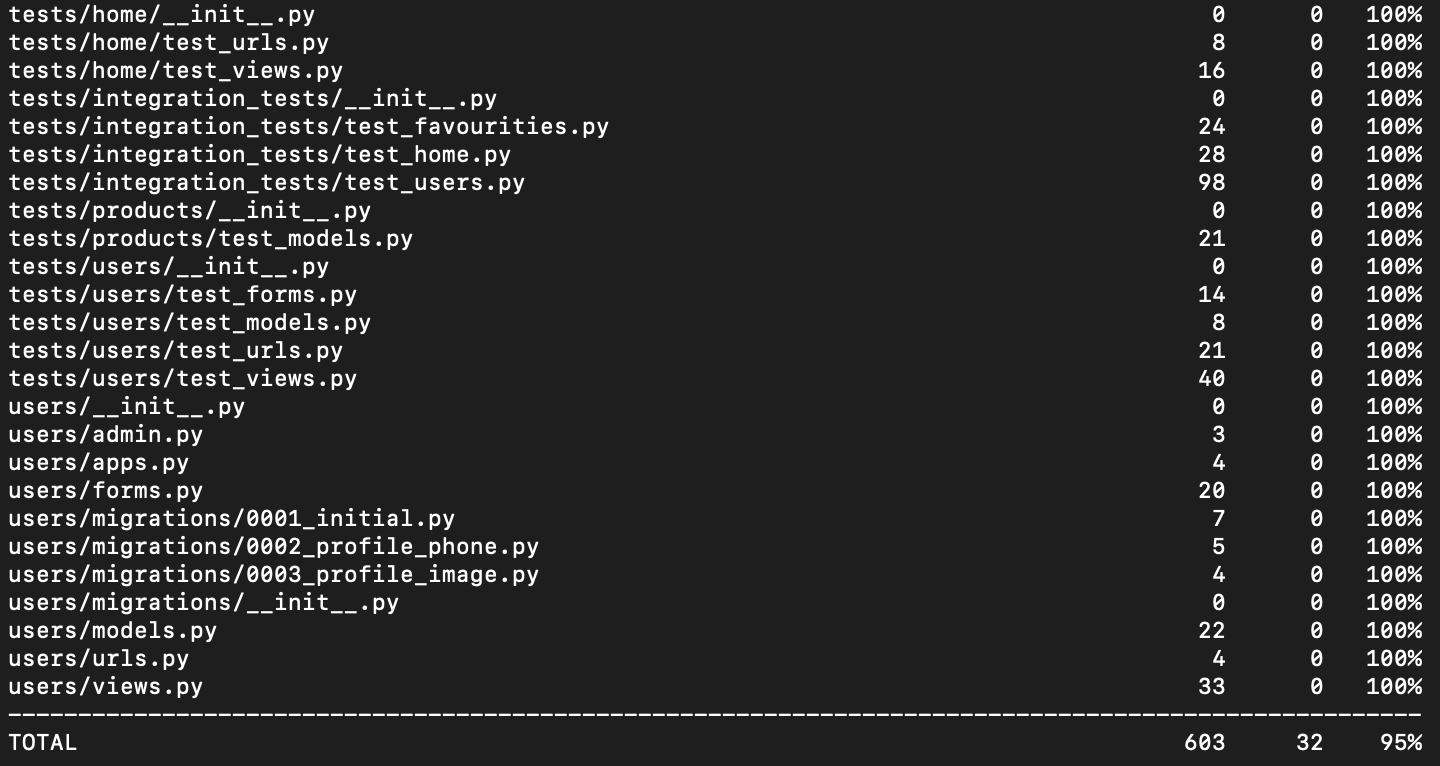
On the last line of the report, we can see the average code coverage. In this case, it’s 95%. However, if we look more closely at the filenames, we can see that we’re also calculating code coverage in the test files, which is completely pointless.
Exclude Files From the Report
We can create a configuration file to specify the files that we don’t want to include in the count. This will avoid us including files that are external to the project or that don’t contain source code. Otherwise, the coverage rate will be misleading.
In our case, we want to ignore test files located in the tests/ directory.
First of all, you need to create a .coveragerc file at the root of the project, then add the following code to exclude a directory:
[run]
omit = directory_path/*
So for our problem with the test directory, we’re going to add the following lines to the .coveragerc configuration file:
[run]
omit = tests/*
Run the pytest --cov=. command again. You’ll see that the test files have disappeared from the report.
Now you can analyze the report and take note of the files that don’t have sufficient coverage. However, the report displayed on the terminal isn’t particularly detailed, because it only provides the coverage percentage. It’s not obvious which lines of code need to be covered to achieve 100%.
Don’t worry. Pytest provides an option that gives you details of the lines to be covered by a test.
Generate an HTML Report
Pytest provides an option to generate the report in HTML format. The report contains lots more detail than the terminal display. As well as the percentage of lines covered by the test, it provides details of the lines that are not covered by the test. This will make it easier for us to set up a test to cover this part of the code.
To generate an HTML report, we need to add the following option to the command we used earlier: --cov-report html . This gives us the full command: pytest --cov=. --cov-report html .
After the script has completed, you’ll find that a new folder htmlcov has been created in the location where you ran the command. This folder contains various documents, including some HTML files.
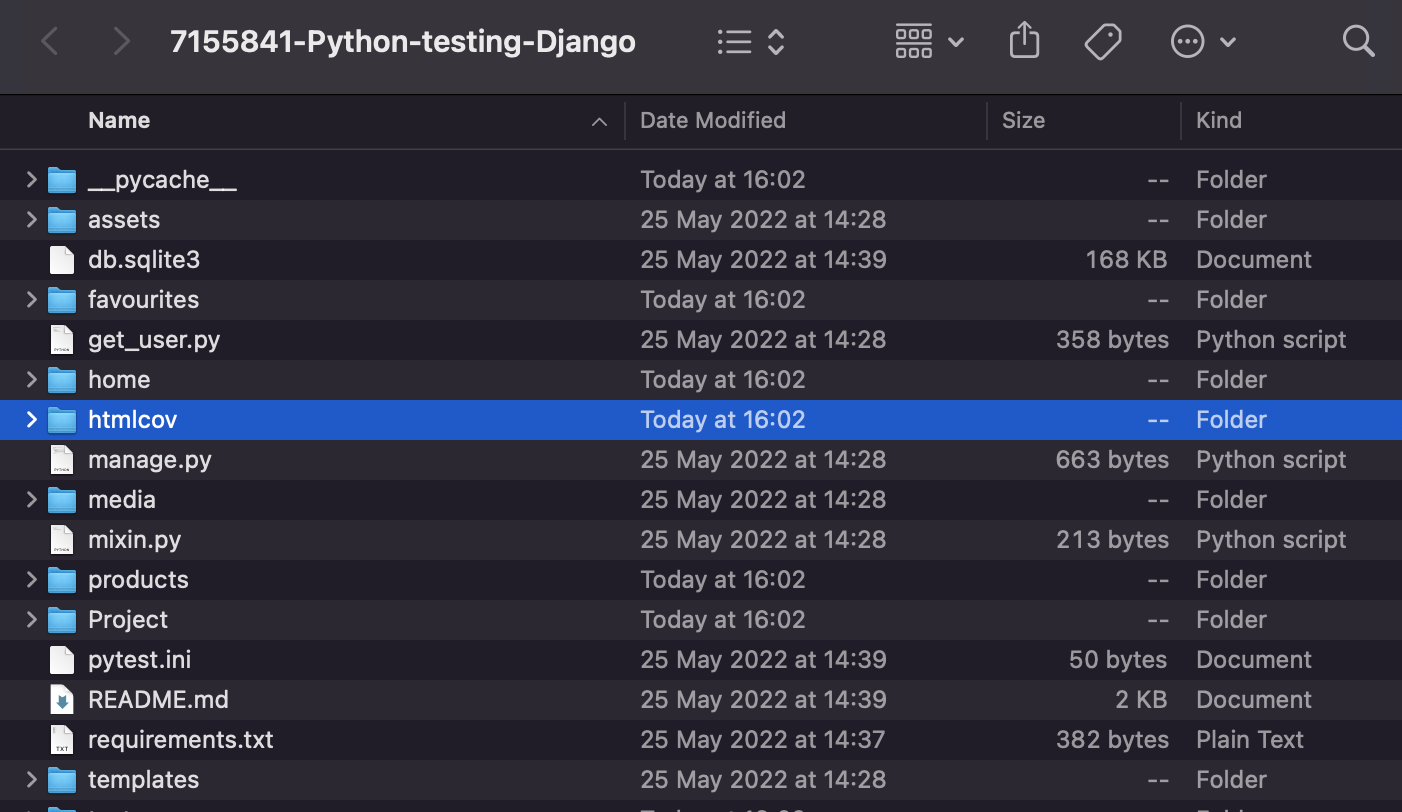
Open the index.html file, which contains a summary of the coverage report. From this page, you can browse the different files to see the coverage details. You’ll end up with a detailed report for each source file in HTML format.
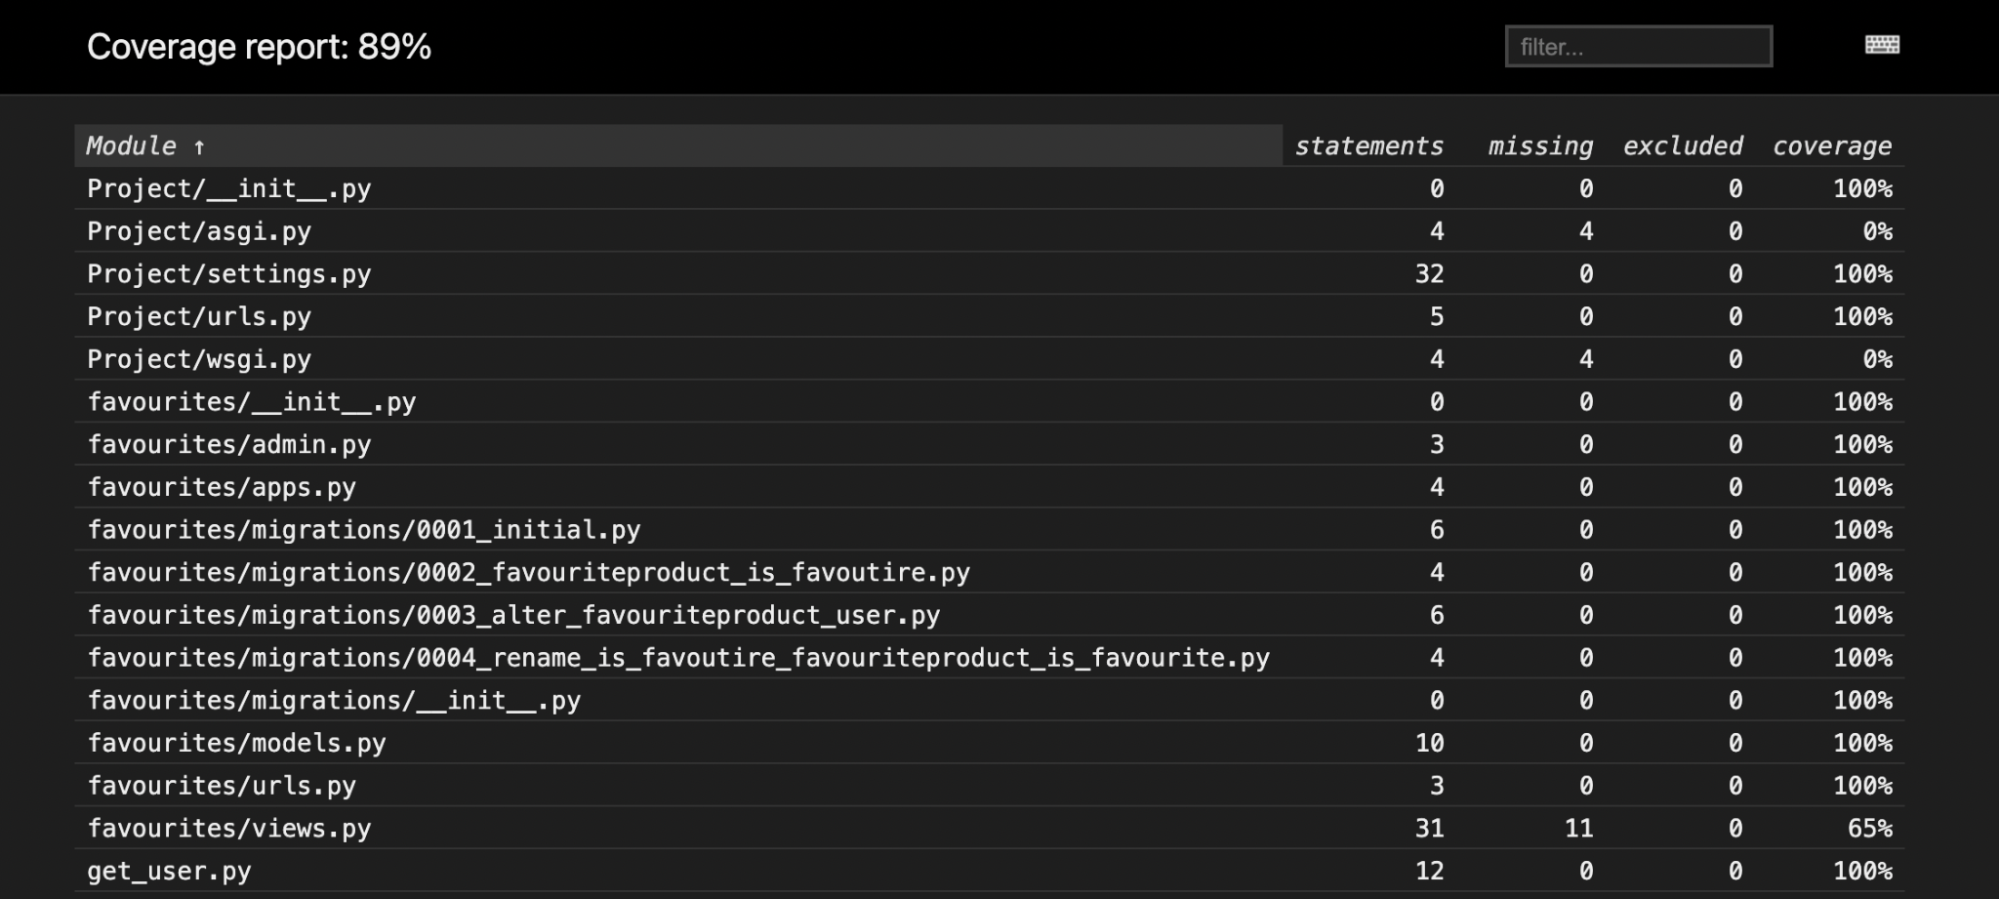
Firstly, we can see straight away that our code coverage is 89% as it’s mentioned top left on the report Coverage report: 89% . We also have the details for each file with the coverage rate. Unlike on the terminal, you can click on a filename to get more details about the coverage on a line-by-line basis.
Let’s click on the favorites/urls.py file, which only has 65% code coverage, and see what happens.
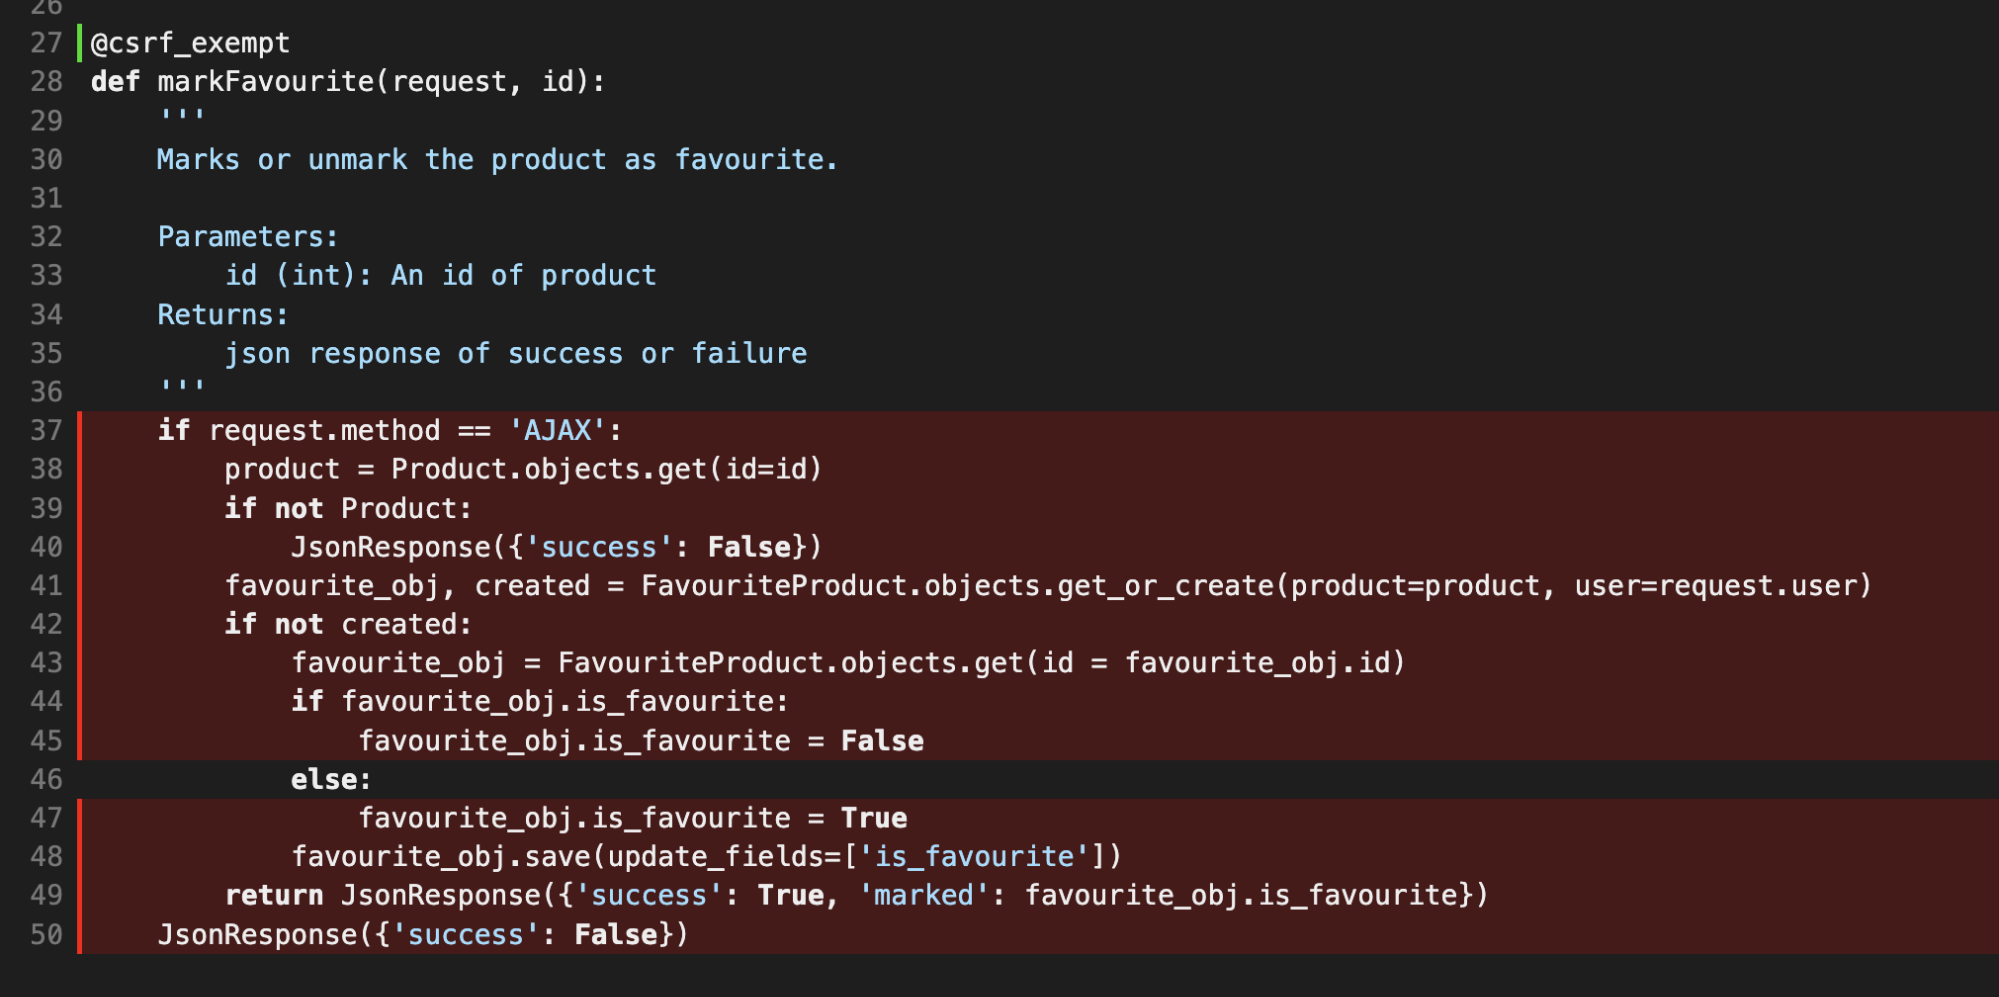
The coverage tool has highlighted code that hasn’t been tested in red. So, as we can see, we haven’t tested the whole of the markFavourite function. We still have some work to do!
In this video, you’re going to see how to display your test coverage report either on the terminal or by using the HTML report.
I’ll leave you to get on with your testing! In the meantime, I’ll start creating some integration tests.
We’ll find out more about them in the next chapter!
Let’s Recap!
Test coverage checks the percentage of lines of code covered by the testing.
The Pytest framework combined with the
pytest-covplugin calculates the coverage rate of an application using the following command:pytest --cov=source_code_directory. Remember to specify the folder containing the source code in the--covoption.A configuration file
.coveragerchas anomitvariable that is used to hold file or folder names that you don’t want to include in the coverage calculation.The
--cov-report htmloption generates a detailed HTML report that will enable you to more easily identify the lines of code that need coverage.
Well, it seems like you’ve reached the end of part three of this course. Let’s keep going. It’s time for a quiz so that you can assess your new testing knowledge.
