Assess Ad Performance
In the previous part, we created, set up and launched our campaign.
Now that a little time has passed, it’s time to go back to our Google Ads account to analyze the results and see how best to optimize them.
Let’s get started!
Analyze Your Ad Campaigns
So, we’re back in the Campaign tab within the Google Ads interface. Seven days have elapsed since we launched our campaigns.
In other words, the ads have been live for a week with a daily budget of $10 for each campaign, giving a total daily budget of $70.
We’re going to conduct a review of this first week where we’ll analyze the performance of these different campaigns.
To start us off, let’s take a look at the overall stats across all seven campaigns.
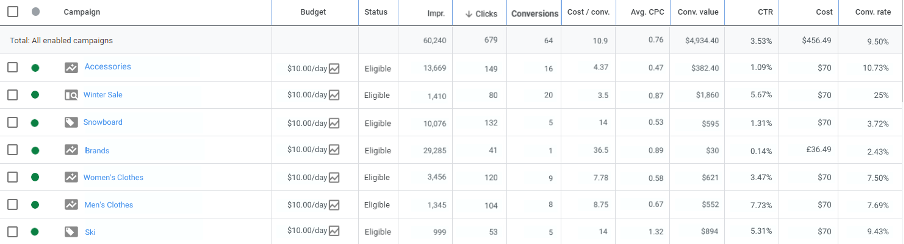
As you can see above, our ads have been displayed over 60,000 times and we achieved 679 clicks, which gives us a click rate of 3.53%.
3.53%? That’s not much, is it? Is that CTR good or bad?
I’d love to be able to give you a simple answer by saying that a click-through rate below a certain level is bad and above a certain level is good, but in reality, it’s a little more complicated than that!
Depending on the sector, a click-through rate could be interpreted in a completely different way.
So, for real estate loans, we might well see click-through rates of 0.05%, whereas consumer goods such as clothes could average a rate of over 5%.
The click-through rate (CTR) can also give us an idea of the quality of our ads.
One of the solutions if you have a low click-through rate for your particular industry is to test new ads or update and improve your existing ads.
Control Advertising Costs
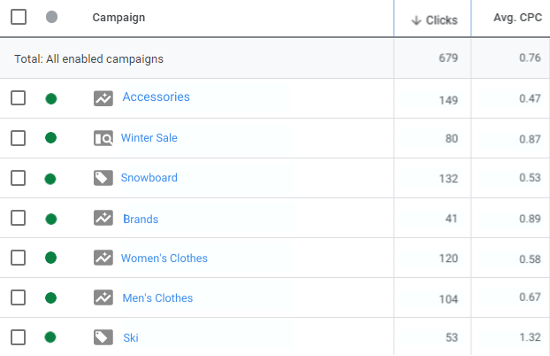
Another piece of data to look at when analyzing your campaigns is the average cost per click (CPC).
The higher this is, the lower the number of clicks we can have within our daily budget. We can see this in our Ski campaign, where our average CPC is way higher than the other campaigns. This puts a limit on the number of clicks received, making it one of our weakest campaigns.
In this case, we need to have a look at the keywords we’ve been targeting.
Maybe some of them have brought the average up, so it would be good to consider whether we should keep these keywords or remove them from our target keywords list.
We’ll use the conversion stats to help us make this decision.
The second campaign, the Brands campaign, shows a lower number of clicks than the others. But we have a bit of a problem here, because as you might have noticed, the average CPC is quite high.
We had a weekly budget of $70 for this campaign, but we can see that we’ve only spent $36.49.
We can conclude from this that Google Ads wasn’t able to spend all of our budget, because our ads were outbid by our competitors.
We’re going to take note of this and see what we can do about our Brands campaign in the next chapter.
Fortunately, some of our campaigns did really well.
The Winter Sale campaign spent its entire budget and has an excellent click-through rate, which means it successfully managed to attract users.
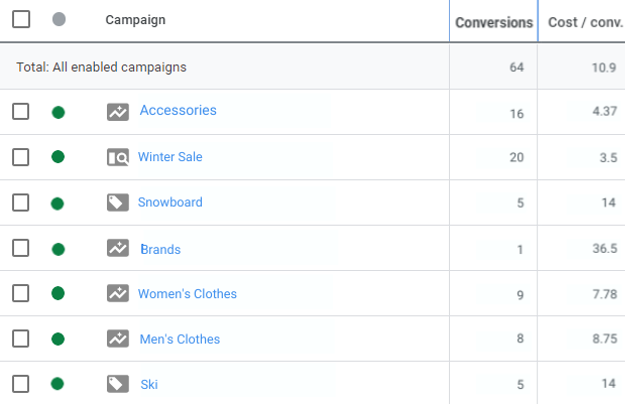
Here we can see that this campaign resulted in 20 conversions.
Out of the 80 people who clicked on the Winter Sale campaign ads, 20 (i.e., a quarter of them) actually purchased products from the website.
Another example is the Accessories campaign, which brought in 16 conversions, which sounds great! However, if we look a bit more closely, we can see that the cost per conversion is a little higher than it was in the Winter Sale campaign.
Study Conversion Volumes and Values
If we really want to assess the performance of a campaign, we need some additional information: the sales revenue generated by our ads on Google Ads.
To access this information, we needed to properly set up conversion tracking on our website and link our Google Ads account with our Google Analytics account, making it possible to track transactions.
The full process required to link your Google Ads and Analytics accounts can be found via this link to a Google Ads help page.
Let’s imagine that this is all properly set up on our Google account and website.
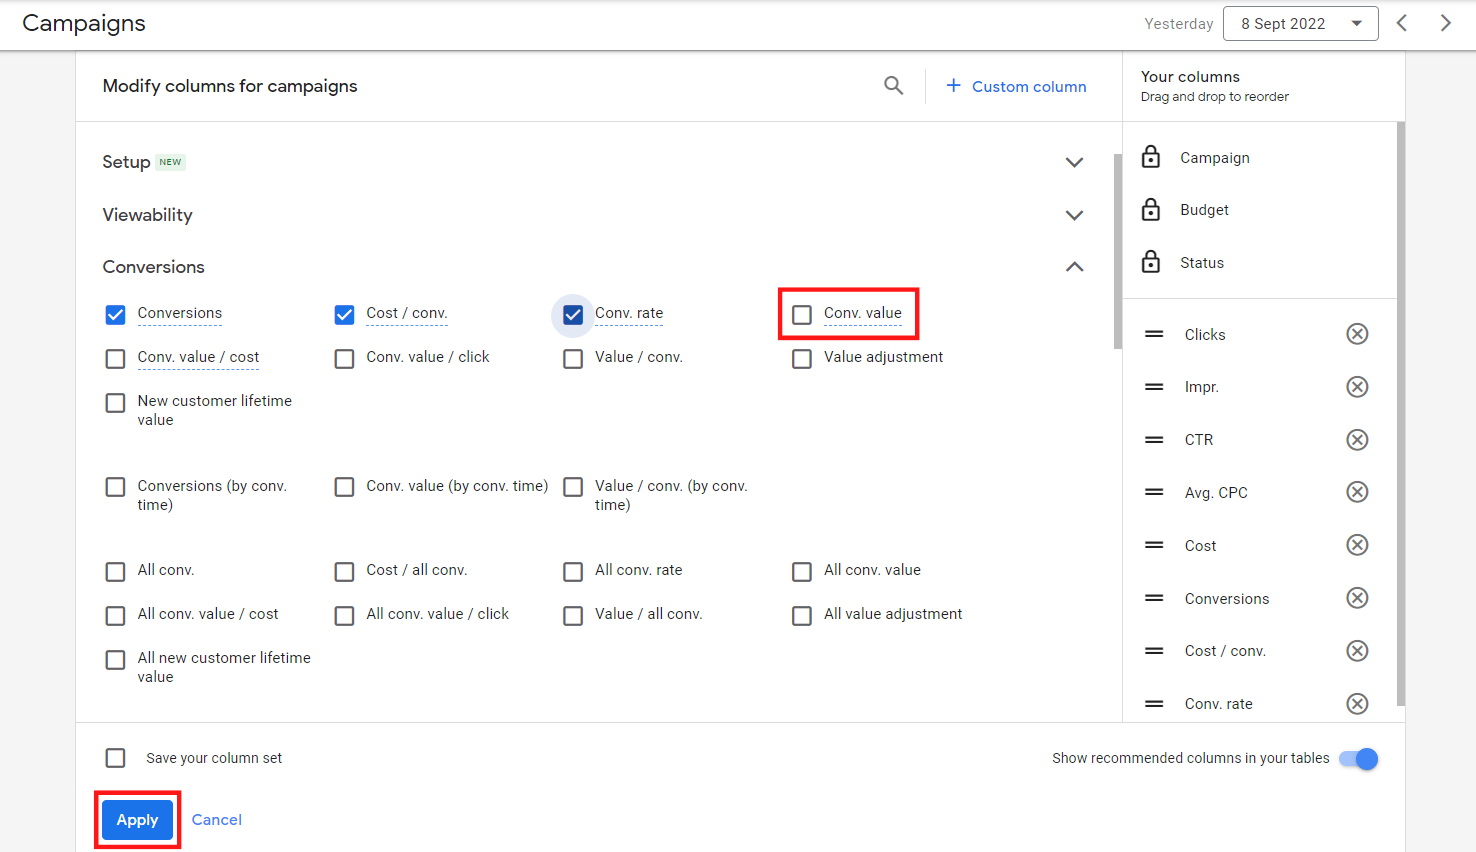
We’re going to add a column to our campaign analysis table.
We’ll call this column Conversion value.
We can do this by clicking on the Columns button top right in the table and select Modify Columns.
You can get even more data about your Google Ads campaigns’ financial performance and user behavior on your website using Google Analytics.
But for now, I’d like to show you a few indicators:
Our 679 clicks have cost us $456.49 and have generated almost $5,000 in sales revenue across all campaigns:

Okay, but generating $4,934 in sales revenue isn’t the same as a profit of $4,934, is it?
Well no, this isn’t your profit.
If you want an exact figure for the profitability of your campaign, you need to work out the profit margins on the products that generated the sales revenue. You can’t get this information from Google Ads or Google Analytics, so you need to work it out yourself.
If you want to continue optimizing your campaigns, you need to know which of them have been profitable and which of them haven’t.
For example, if we look at our Brands campaign, this has cost us $36.49 and the only conversion we had generated $30 in sales revenue.
If the sale was a t-shirt that only brings our business $10 in profit, we’ve literally lost $26.50.
Let’s take another example from the Snowboard campaign. We only spent $70 on advertising costs, but our ads generated $595 in sales.
If you work it out, you can see that your margins need to be 11% or more within the Snowboard range to make your campaign profitable.
This would definitely explain why our Winter Sale campaign was so successful. As the name indicates, all of the products were discounted. We deliberately sacrificed our profit margin so that we could earn revenue and sell excess stock.
With all of these insights, we have what we need to improve our campaigns.
Let’s Recap!
Analyze your campaigns using an initial test phase. First look at overall performance to uncover trends and then drill down into the details of each campaign.
The click-through rate gives you an initial indication of campaign performance and ad quality.
If your campaign goal is ROI, analyzing conversions is essential. The important metrics in this case are conversion rate, cost per conversion, and conversion value.
To assess campaign profitability, you need to analyze the revenue generated by your Google Ads and deduct your margins.
Now we’ve been able to clearly identify what worked well and what didn’t work so well in our testing phase, we can go ahead and optimize the campaign.
And that’s the subject for our next and final chapter, so come join me!
