Create Your First DataFrame Using Pandas
Prepare Your Dataset
As we’ve seen, NumPy arrays are particularly effective when we’re dealing with numeric values. But, in reality, data doesn’t only consist of numbers and figures.
We also find:
Categories
Labels
Dates
Plain text
In the world of data analysis, data generally conforms to a predefined format, where each row corresponds to an individual (in the statistical sense of the term), and each column represents a particular attribute of the individual. These are what we call variables.
Here are a few examples to illustrate the concept:
In the car industry, each individual could be a car, which can have the following attributes: engine power, vehicle size, make, model, color, etc.
In a retail study, each individual could be a product and we can list various product attributes, such as price, product category, etc.
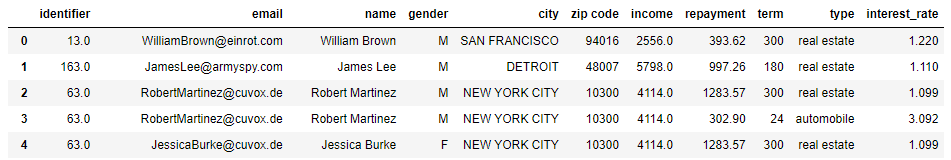
In the banking sector, each individual could be a person and we might want to hold data about their average salary, gender, monthly loan repayments, etc.
So, let’s see an example of what this final case could look like:
When thinking about data formats, you might have imagined an Excel file, and actually, that’s not a bad idea. The Excel format is used by many companies to store and manipulate data. But it’s not the only storage format—there are many others.
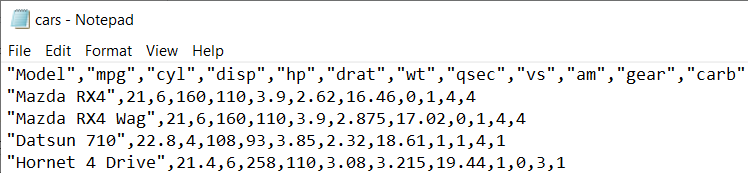
For example, we often see text files or CSV files. These are files where the raw data is stored and separated with a delimiter.
Here’s an example of a car dataset with a comma delimiter:
Data can also be stored in JSON format. JavaScript Object Notation (JSON) is a standard format used to hold structured data. It looks like a big Python dictionary that can hold other dictionaries and/or lists. Well, that might be a bit of an oversimplification, so here’s a picture to help bring it to life:
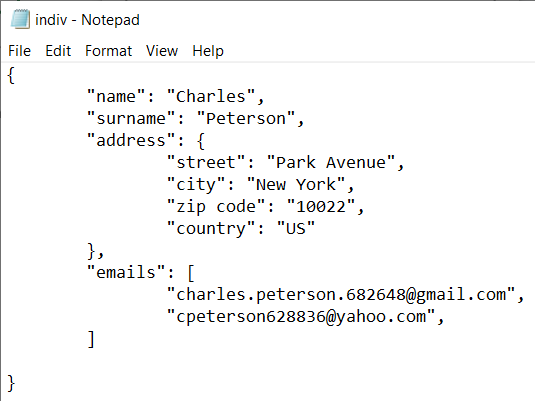
We’re not going to delve any further into JSON files on this course, but there are lots of resources out there that go into more detail on the subject. JSON is a standard format used in the IT world.
So, we’re looking for a tool that will structure our data in the desired format (individuals/variables), let us manipulate data of different types, and read data from different sources. This tool is none other than Pandas library. And more specifically, Pandas DataFrames.
A DataFrame is a Python object that stores data in the form of a table, where each column is explicitly named. It follows the same rules as a NumPy array, in that different columns can hold different types of data, but a single column can only contain one data type. This structure means that variables can be accessed more easily and many types of simple or more complex data manipulations are possible.
But hold on a minute—why would we use the NumPy library if Pandas can do all of this?
That’s a great question! As you go through this course, and when you’re out in the big bad world of data analysis, you’ll be switching between the two on a regular basis. It’s pretty common to apply methods to DataFrames that return arrays, and to turn these arrays back into DataFrames later on. This is why you need to understand both libraries so that you’re fully prepared before you delve into your data analysis.
So, how about diving into your very first DataFrame?
Generate Your First DataFrame
We’re going to create our first DataFrame using the formats we mentioned above. And as sharing is caring, we’re going to ask you to import the same dataset in three different formats: Excel, CSV and JSON.
You’ll find the three files within this ZIP file. Let’s move on to the practical part:
Once you’ve imported the DataFrame, you can get started on the real work of manipulating the data. But before you manipulate any data, you need to really get to know your dataset.
Identify the Attributes in Your DataFrame
Pandas provides a number of efficient ways of doing this.
Preview the DataFrame
As shown above, it’s good practice to preview all or part of your dataset before importing it or carrying out any manipulations—even if it’s just a few rows—just to check that everything’s as it should be.
There are two main methods we can use to do this:
The
.head()method lets you select the first five rows of the DataFrame (by default). You can specify the number of rows to display within the parenthesis.The
.tail()method lets you select the last five rows of the DataFrame (by default). You can also specify the number of rows to display within the parentheses.
Here are some examples:
# load the file
import pandas as pd
customers = pd.read_csv("customers.csv")
# display the first 5 rows
display(customers.head())# display the last 2 rows
display(customers.tail(2))# display the 5 first and last rows
display(customers)You can also access the global properties of a DataFrame.
Access the Global Properties of a DataFrame
By global properties, we mean attributes and general information that is held for all DataFrames and that we need to access regularly.
First of all, we have the DataFrame dimensions. How many rows are in the DataFrame? And how many columns? Just like we did with NumPy arrays, we can use the .shape attribute to get this information.
customers.shapeThe result comes in the form of a tuple. It’s relatively simple to read. The first element is the number of rows and the second is the number of columns. We can obviously store the result returned by this attribute in a variable so that we can use the elements later on:
dim = customers.shape
print(dim[0]) # 228
print(dim[1]) # 4
As well as dimensions, we might want to know the data type for each variable. We can access this really easily using the .dtypes attribute:
customers.dtypesThe result should display as follows:
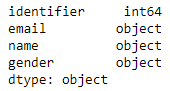
This makes it easy to get the data type for each variable in our DataFrame, albeit displayed in quite a sterile way.
So, we previously spoke about the link between Pandas and NumPy. Now, let’s see how this link works by transforming our DataFrame into an array.
customers_array = data.values
display(customers_array)
Voilà! It’s as easy as that. We now have a NumPy array instead of our DataFrame.
Let’s Recap
In the world of data analysis, data is generally presented and managed in table format, where each row represents an individual and each column represents a variable.
The Pandas DataFrame brings this format to Python.
There are a number of data storage formats available, such as delimited files (CSV, text), JSON or Excel files.
The Pandas DataFrame object lets you manipulate data quickly and easily:
by importing data in all different formats.
by accessing the general properties of a dataset, such as variable data types, number of rows, number of columns, etc.
Now that we understand DataFrames in general, it’s time to explore Pandas in a bit more detail and find out how we can use it to manipulate a DataFrame.
