Collect and Analyze Your Data
Did you find this data collection work time-consuming and demanding?
If you are doing an audit for the first time, you may find yourself overwhelmed by the amount of information available.
You still don’t know what you’ll find, and you spend a lot of time sorting out useful information.
To help you in this task, you might like to know that many online reputation monitoring and management tools are available, proportional to the amount of data you need to analyze.
While some are free, such as Social Searcher or Google Alerts, others can cost up to $10,000 per year. It all depends on your needs and the effort and investment you want to put into monitoring your online reputation.
Platforms such as Meltwater offer advanced solutions in social listening (monitoring your social networks), media monitoring and analysis, audience analysis, and influence marketing.
Paid platforms are particularly suitable for big accounts with a large volume of data to analyze (especially brand sentiment) or companies wanting to carry out specific monitoring and not miss any news or mentions.
One of my favorite curation tools is Feedly. Its free version allows you to reference all the media and blogs that interest you by theme. Every day, you will find all the new content on a single interface. It’s an incredible time saver!
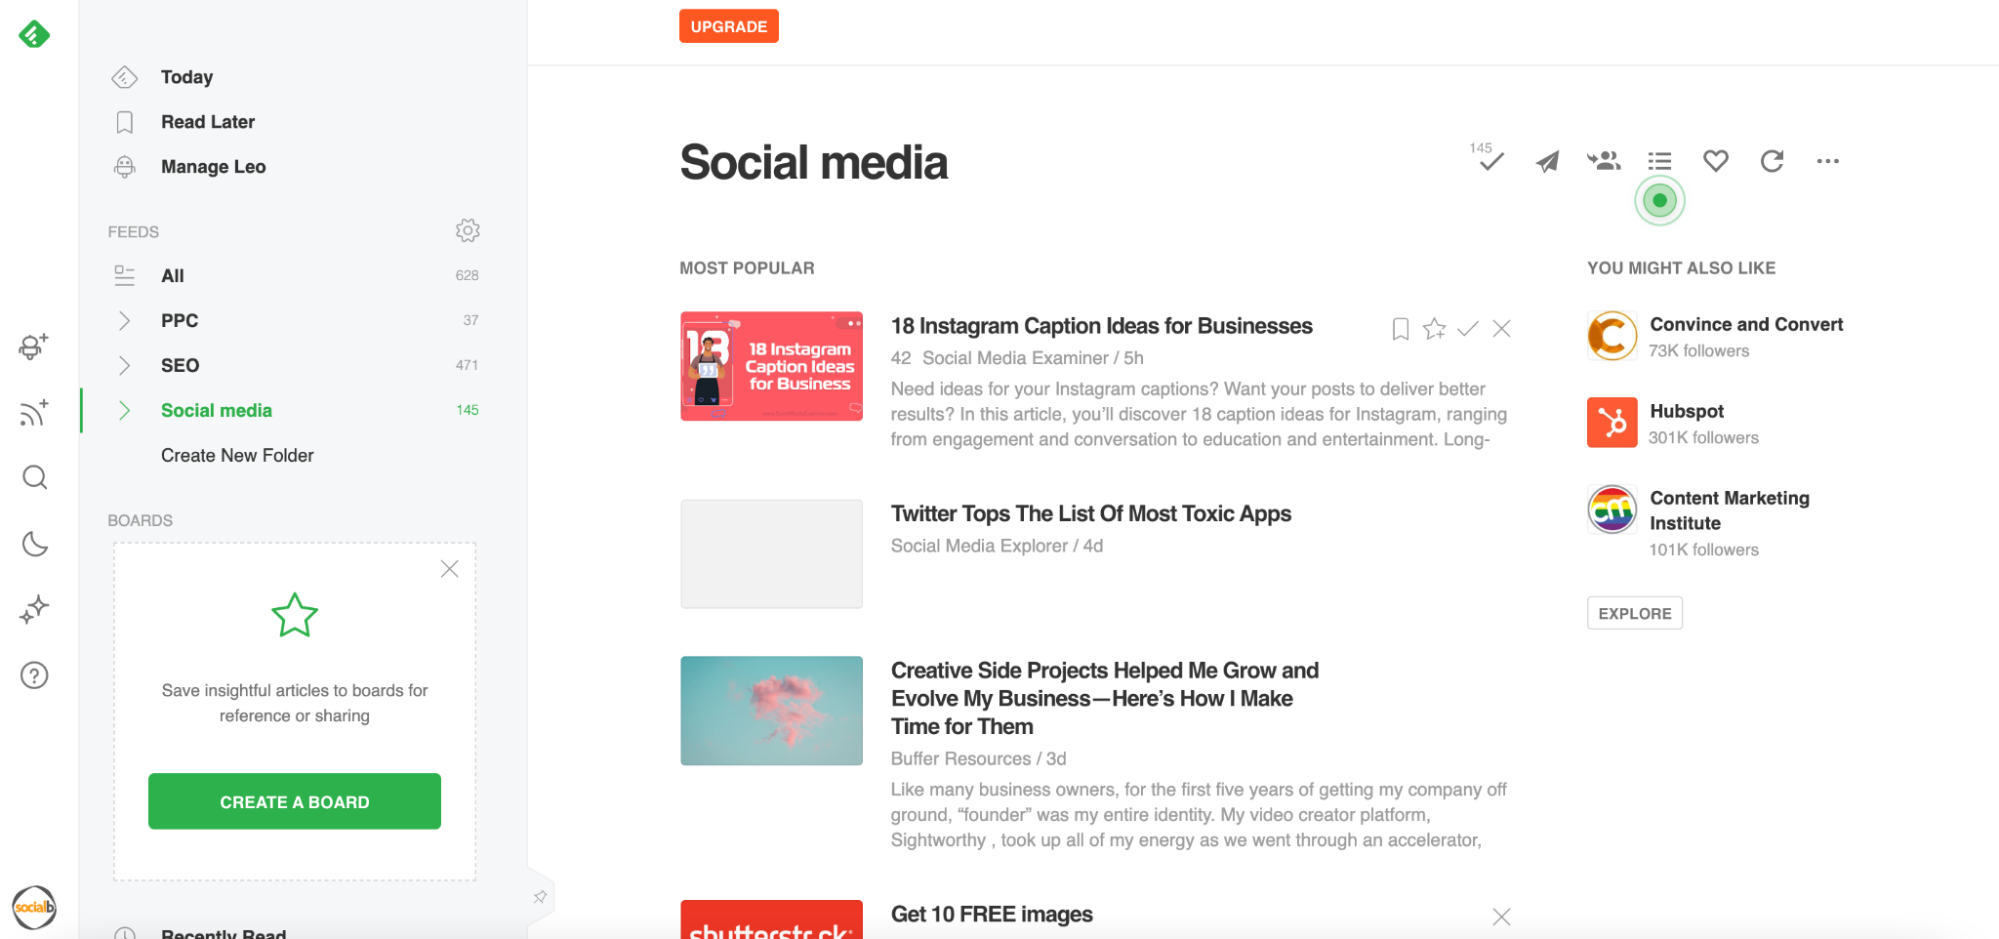
In addition to automating your data retrieval, you must learn how to select the data that meets your needs.
Here’s a step-by-step guide on what you can do:
Step 1: Check Your Target
Checking your target is the basis of a good audit strategy.
Knowing your target, you can choose the right platforms to analyze. With a 50+ audience, there’s not much point in looking at your Snapchat stats, which is popular with young people (what are you doing on Snapchat, anyway?!).
This means defining your personas, including their online habits, favorite media, the KOLs they follow, the content they share, etc.
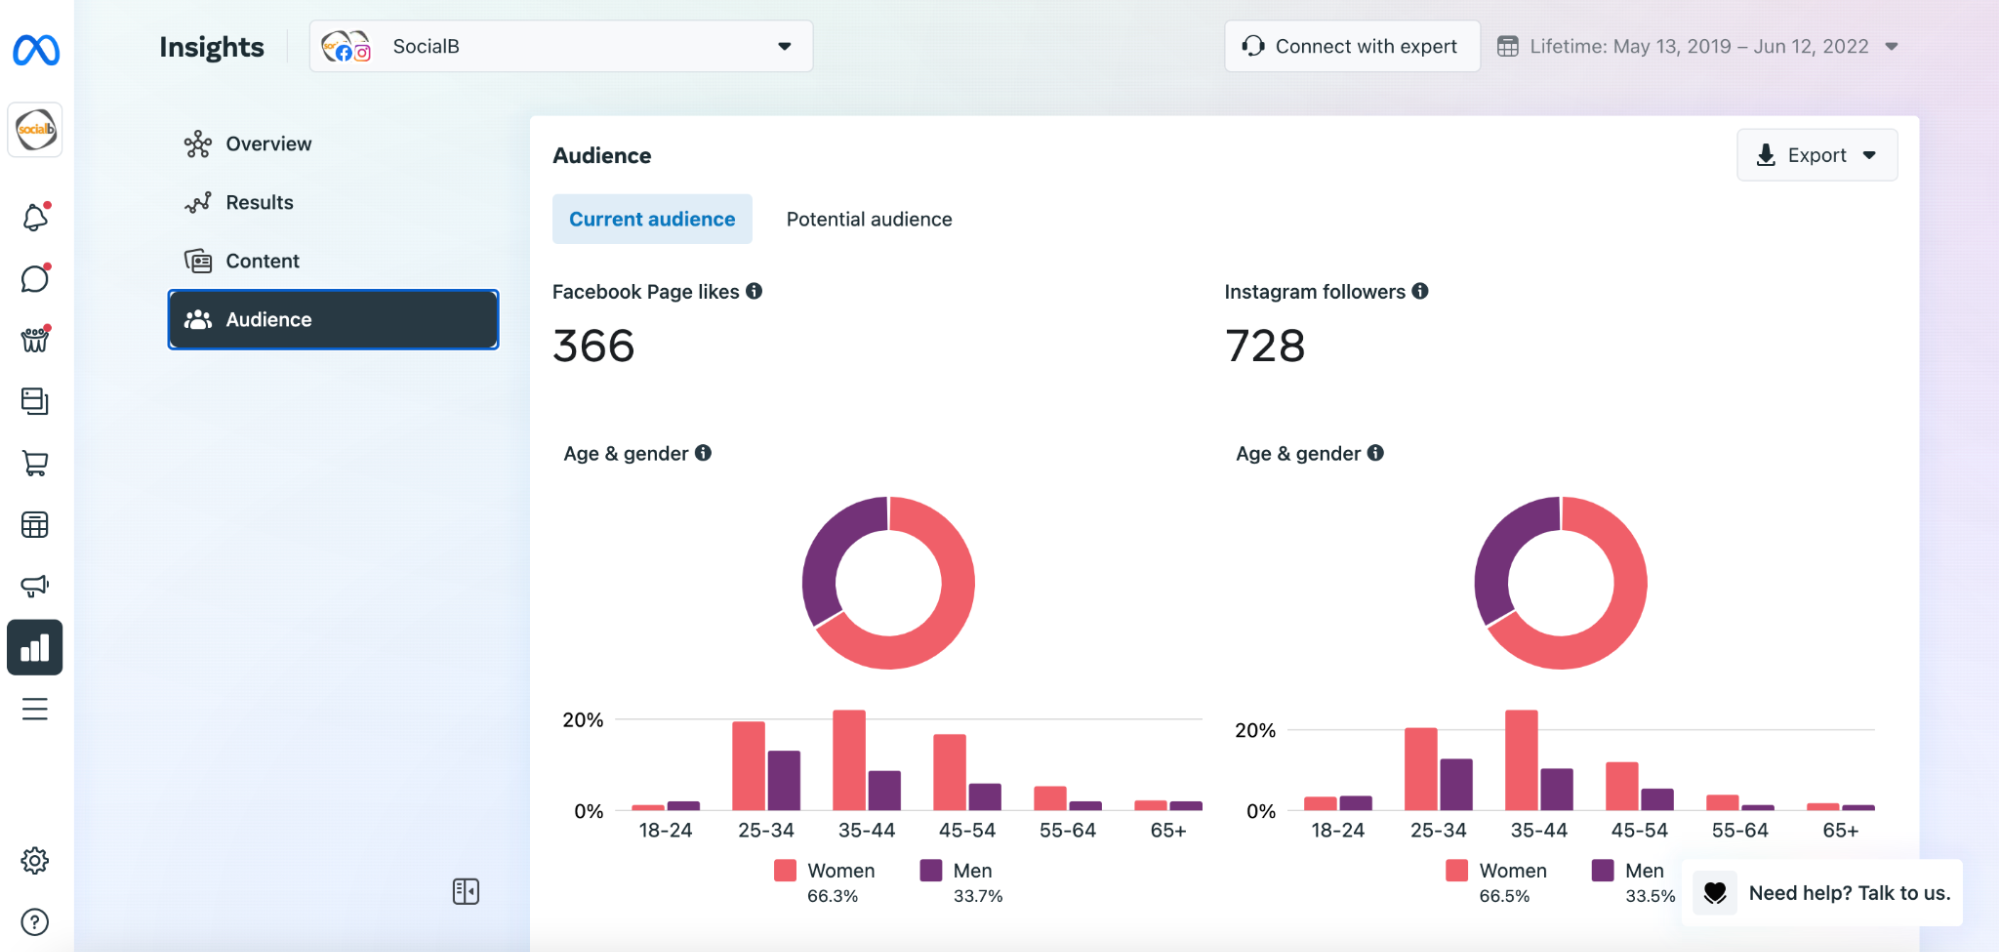
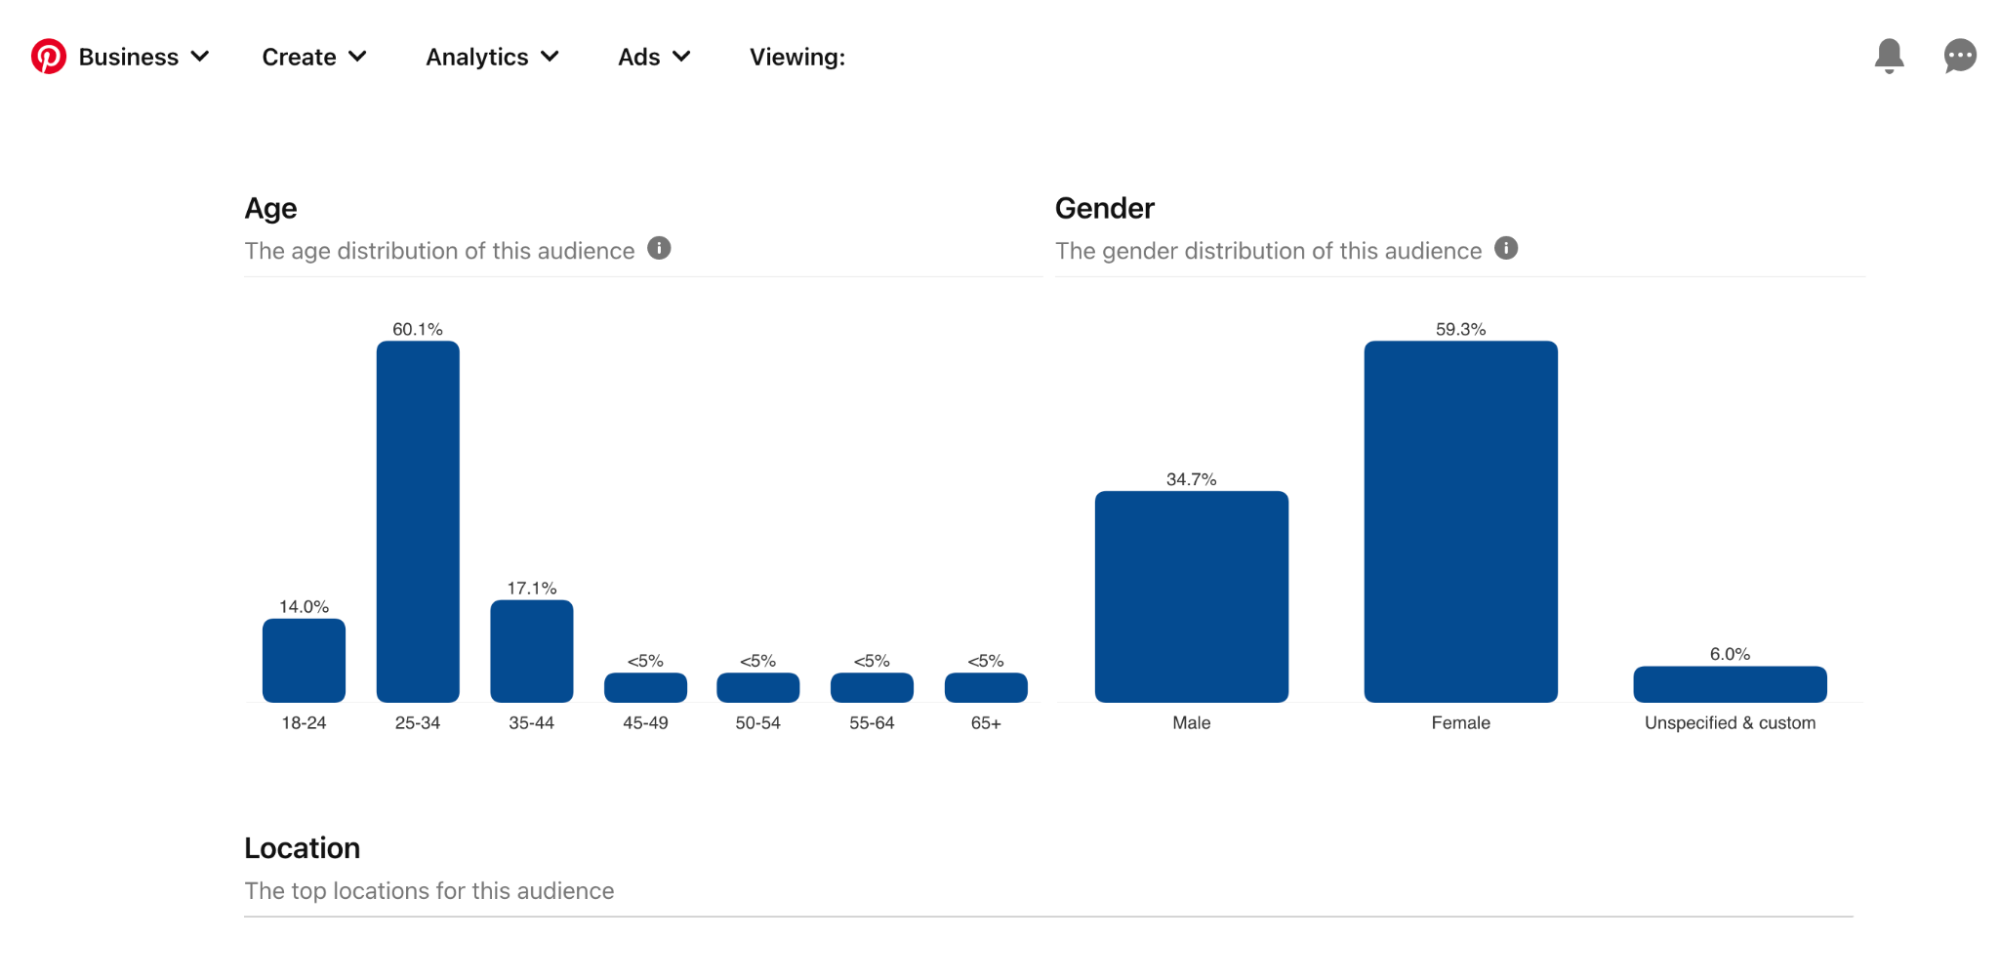
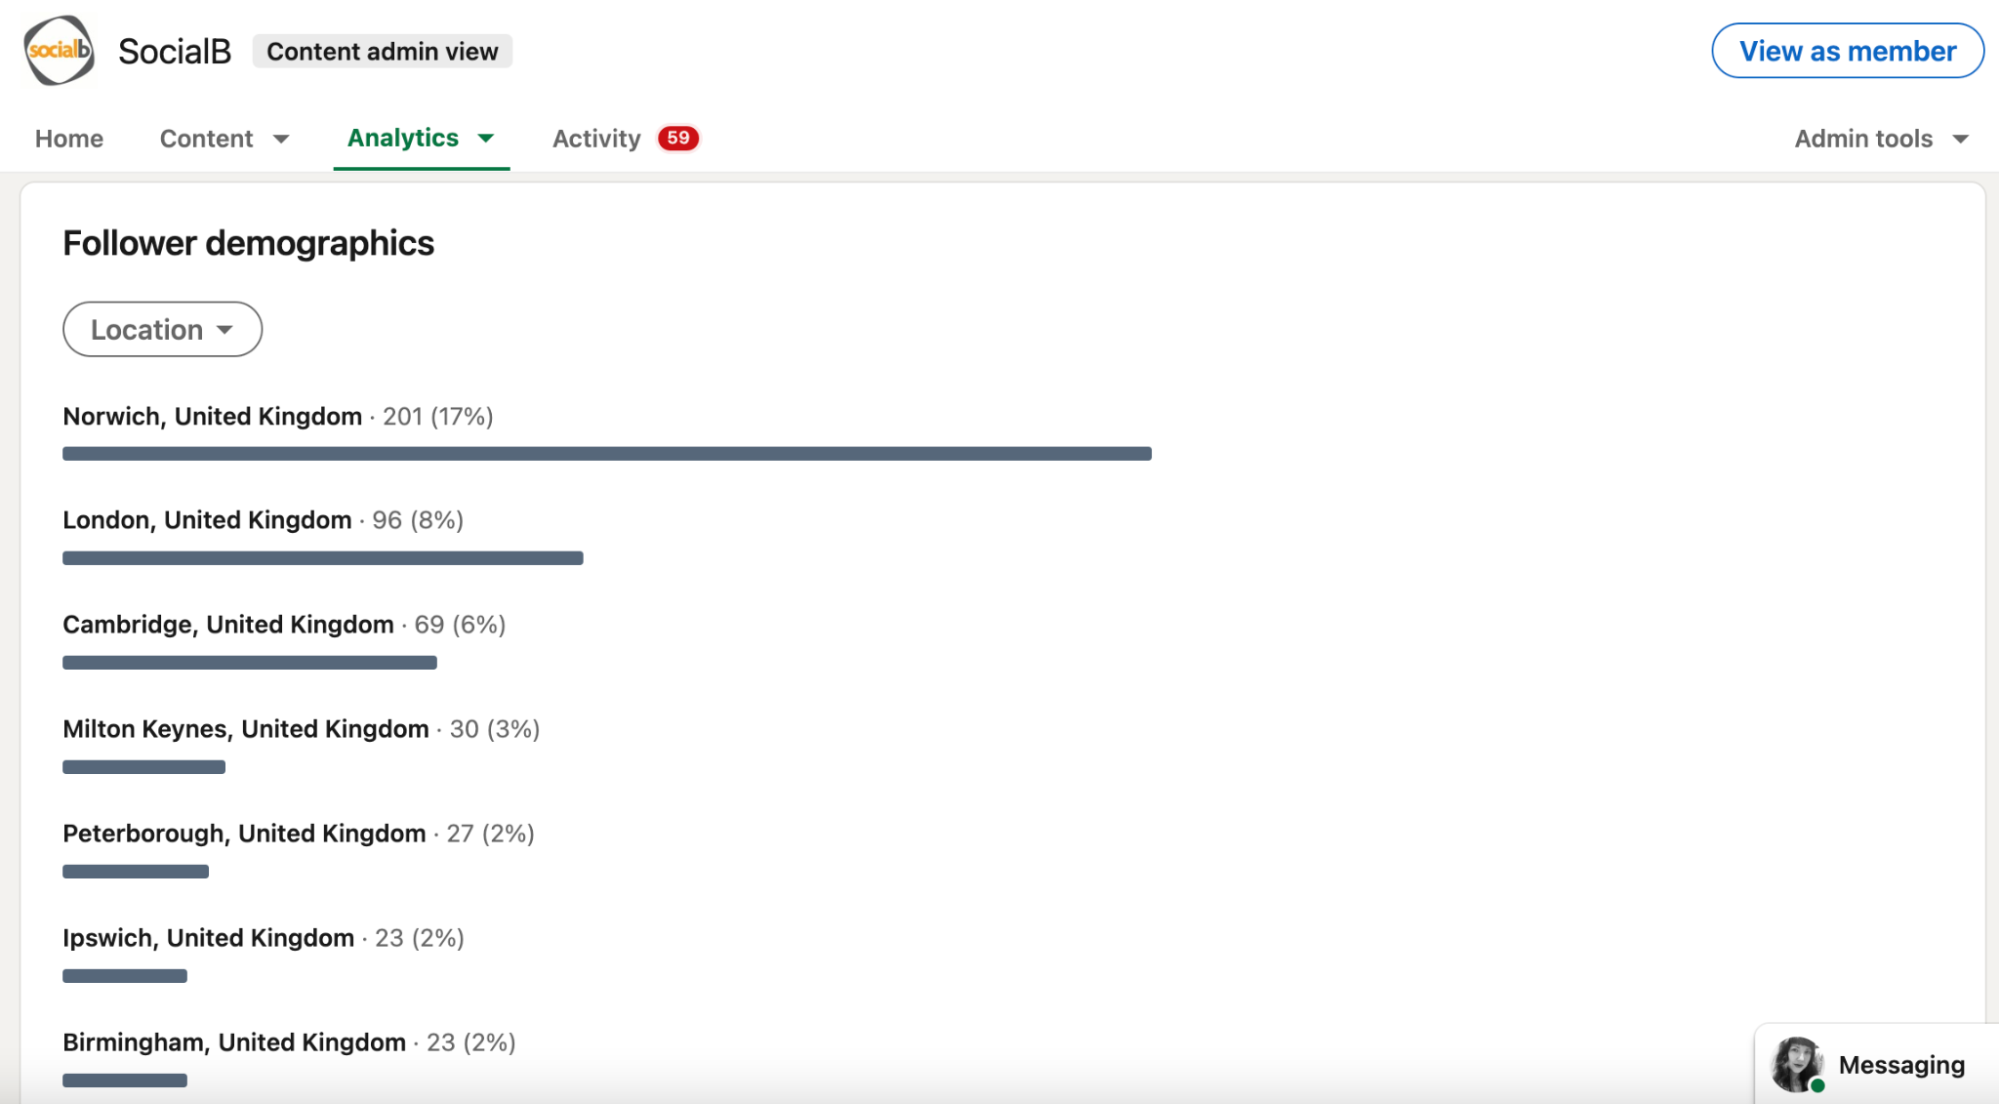
Once you have determined your platforms, go to the statistics section to confirm that the audience reached corresponds to your customer audience.
Here’s what the Audience tab on Meta Business Suite (Facebook and Instagram) looks like:
Here’s the Audience Insights tab for Pinterest:
Here’s the Analytics tab on LinkedIn:
Step 2: Monitor the Consistency of Your Online Content
Set up a content plan to communicate effectively across all your proprietary platforms (website, blog, social networks):
What topics are covered?
When?
On which platform?
In what format?
During your audit, check that your company follows this plan and analyze its consistency.
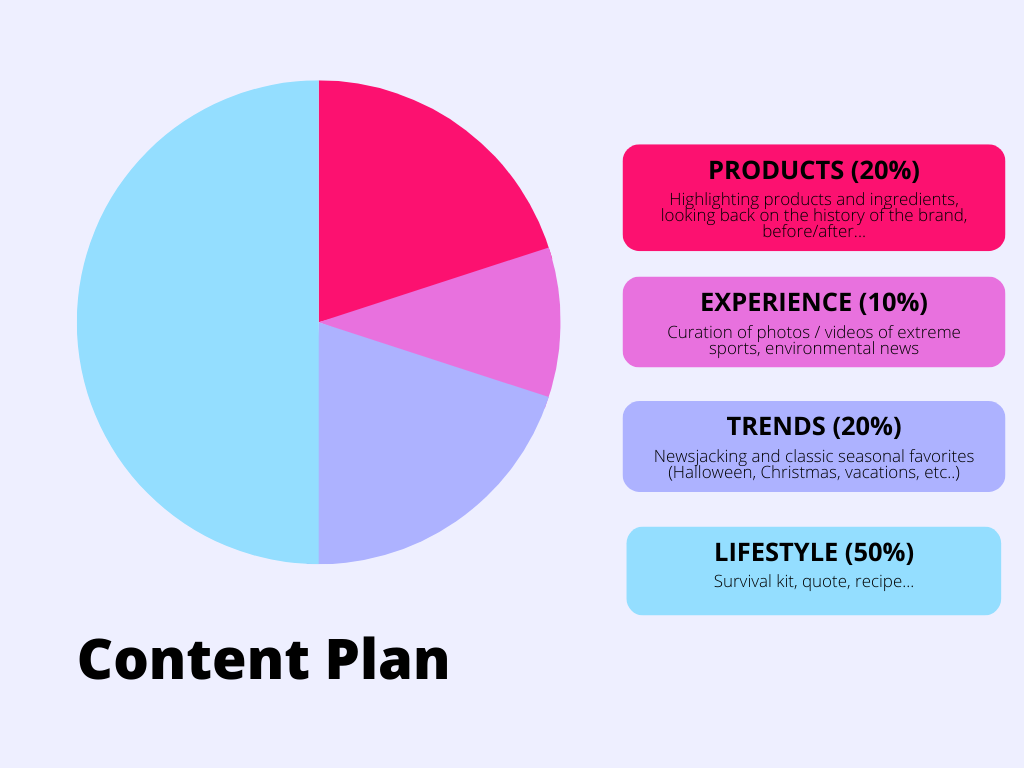
For example, with this content plan, I’m going to check that 50% of my content is about “lifestyle.”
Look at the format as well and ensure that all your platforms are up to date regarding brand image (logo, banner, bio, about us, etc.) and that the published content observes your brand guidelines (colors, style of expression, choice of emojis, choice of visuals).
Step 3: Measure the Impact of Your Actions
This is the time to combine all the data you collected in the previous chapter.
Remember to focus on three to five KPIs per platform analyzed. They should meet your objectives and ideally combine quantitative and qualitative indicators.
It is tempting to want to accumulate as much data and indicators as possible, so you don’t miss anything.
For more flexibility, you can use two types of views:
A summarized view that presents the bare essentials: the three to five KPIs that are key to your daily activity.
A detailed view that gathers all the useful data for further analysis;
Organize Your Data Collection
You can condense the collected data and put it on a dashboard created in a spreadsheet.
It should:
List the data in a clear and hierarchical way to give you an overview of your online reputation.
Focus on the most relevant indicators.
Be updated regularly.
Be easy to share and decipher by the people it is intended for.
You are free to build it by structuring it based around:
Your marketing funnel: Awareness > Acquisition > Interaction > Satisfaction > Conversion.
Your various platforms or media types (owned/paid/earned/shared).
Your geographical areas.
Your products and campaigns.
Take the time to think about it. This dashboard should support you for the long term!
You will have to consult it regularly:
Once a day: Enter your latest mentions and react quickly to urgent matters.
Once a month/quarter/year: Assess your data ( in the form of a report) to establish an action plan for the future.
The Deditex Case Study

See how Michael began to complete his database. You will find it here.
Let’s Recap!
You can automate (or not) your data collection with curation and monitoring tools.
Check that the people reached via your platforms match your target.
Make sure your content plan is consistent in both form and content.
Measure the impact of your actions by choosing three to five KPIs to monitor per platform. Mix qualitative and quantitative indicators.
Compile the data you retrieve in a dashboard to track it over the next few months.
The following exercise will be to extract insights from all these statistics, which you can use to define an action plan.
