Table des matières
- Partie 1
Organize Your Detection Process
- Partie 2
Handle a Security Incident
- Partie 3
Continuously Improve the SOC’s Capabilities
Table des matières
- Partie 1
Organize Your Detection Process
- Partie 2
Handle a Security Incident
- Partie 3
Continuously Improve the SOC’s Capabilities
Collect the Data Required for the Detection Process
At the beginning of the course, we were given a task. In the previous chapter, we broke this task down into risks and events.
Now, how can we detect these events?
This is what we’ll be looking at in this chapter!
Use Logs to Keep a Record of Events
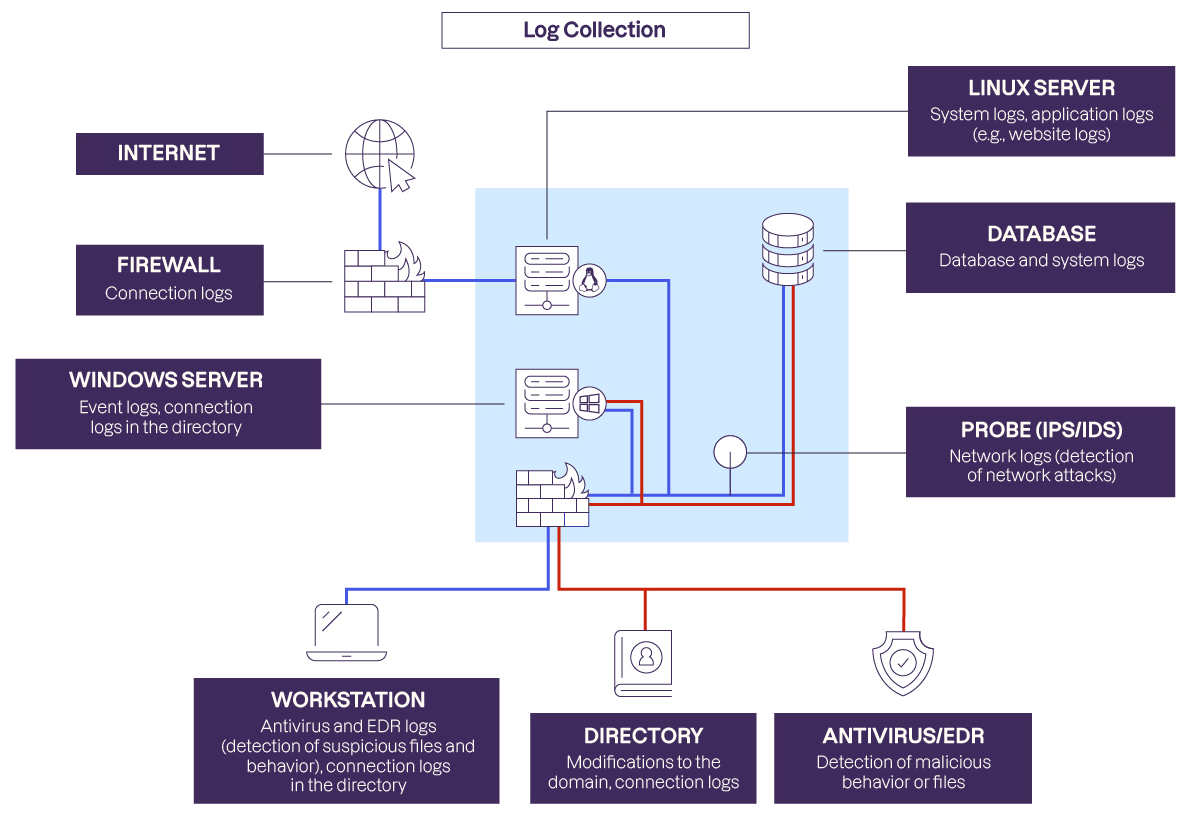
To detect the events that we’re looking for, we need to be able to monitor what’s happening on the IS.
Monitor the Logs
This is done by monitoring the state of the various IS components. We’ll need to constantly monitor any modifications and actions carried out on the various systems.
In practice, this means monitoring the logs.
Logs are files that record the events occurring on a system, such as logins, file creation, and so on.
Supervise the Various IS Systems
Logs are your best source of information for keeping track of what’s happening on the IS! To understand the state of the different IS systems, you need to collect and analyze the machine logs.
Supervise the Applications
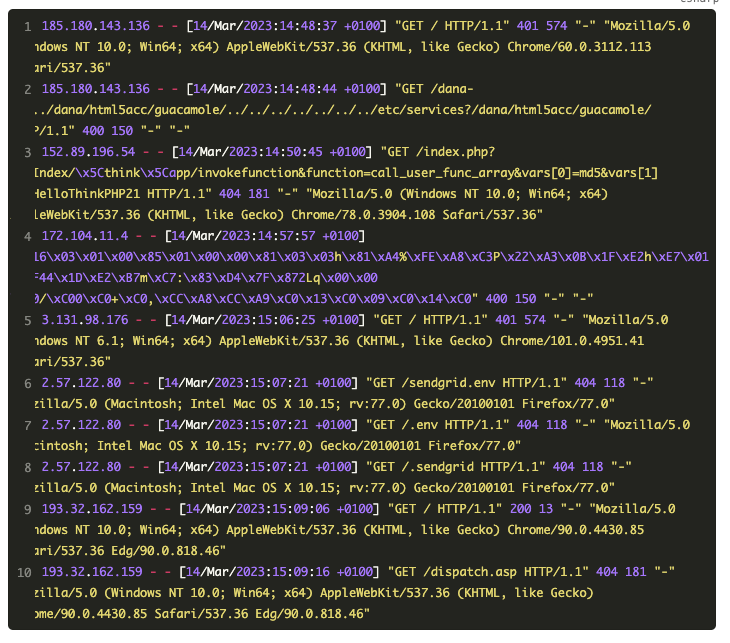
In addition to system logs on the various servers, there are application logs specific to the application or tool running on those servers. You’ll also need to collect these application logs to detect events linked to the use of applications.
Here’s an example of an application log:

Detect Complex Events With Special Equipment
In addition to logs from various IS machines, there are a number of tools available that can provide you with additional information.
Network Equipment
First of all, network equipment logs allow you to identify network actions, such as logins, traffic times and volume, connected IP addresses and domain names, and in some cases, even the content of that traffic.
All of this information can be retrieved from dedicated equipment logs:
VPNs
Firewalls
Routers and switches
Security Equipment
In addition to network equipment, there are existing security tools that will perform the first level of detection for you. Unlike system, application, and network logs, which describe events, security tools enable you to easily aggregate alerts that are easily actionable for you!
These tools include the following:
An IPS or IDS (Intrusion Detection/Protection System) is a tool that can be installed anywhere on the network to detect—and block, in the case of an IPS—attack traces.
A Web Application Firewall (WAF) detects attacks on the content of web requests. Therefore, it only protects websites against attacks that are specifically targeted at websites.
You’re probably already familiar with antivirus (AV) software. Such software detects threats on machines either by comparing programs with lists of known malware or by monitoring their behavior. This is sometimes referred to as EPP (Endpoint Protection Platform).
Detection and Response Tools
The most modern security tools are designed as platforms on which alerts are already aggregated. From these platforms, you can also perform actions on the various systems being supervised, allowing you to detect and respond. These tools include the following:
EDR (Endpoint Detection and Response) tools operate on the same principle as an EPP, but they are more focused on automated correlation between different machines. They can use external threat data feeds or Machine Learning algorithms to identify unusual behavior.
NDR (Network Detection and Response) tools are used at the network equipment level. They add to the centralized data flows coming from the equipment we outlined above, including the firewall, WAF, and proxy. Once again, the advantage is that modern algorithms automatically perform the first level of correlation and detection.
XDR (Extended) tools also go one step further than EDRs, adding data from external tools or applications. For example, an XDR will analyze user activity in the cloud or a suspicious email containing an attachment and then link this event to the opening of the malicious Excel document that was attached to the email.
MDR (Managed Detection and Response)is not a tool but a service offered by a company.

Collect and Centralize Your Logs
All logs generated by the various machines must be aggregated and stored centrally. This makes things easier for you, eliminating the need to search for logs on every piece of equipment.
Most importantly, it’s a way of protecting them! Otherwise, incident processing would become impossible if the logs were deleted (voluntarily or involuntarily). Imagine if your IS were encrypted by ransomware, you’d lose access to all your logs.
Prioritize Log Activation
In practice, storing logs and alerts for all IS equipment requires a huge amount of data! You won’t be able to collect and store everything.
You also can’t store this data for too long. This is especially true if these logs are nominative, meaning that they contain personal and sensitive data. Their storage is then governed by law (such as the GDPR).
Got it. How do I identify which logs are the most important to collect?
To determine which logs to enable as a priority, start with your risk analysis:
Which systems have been identified as having the greatest impact in the event that they are shut down or compromised?
What systems do they depend on for data, management, and security?
Then, gradually deploy the log collection, one security perimeter at a time and one success after another.
Implement Log Collection
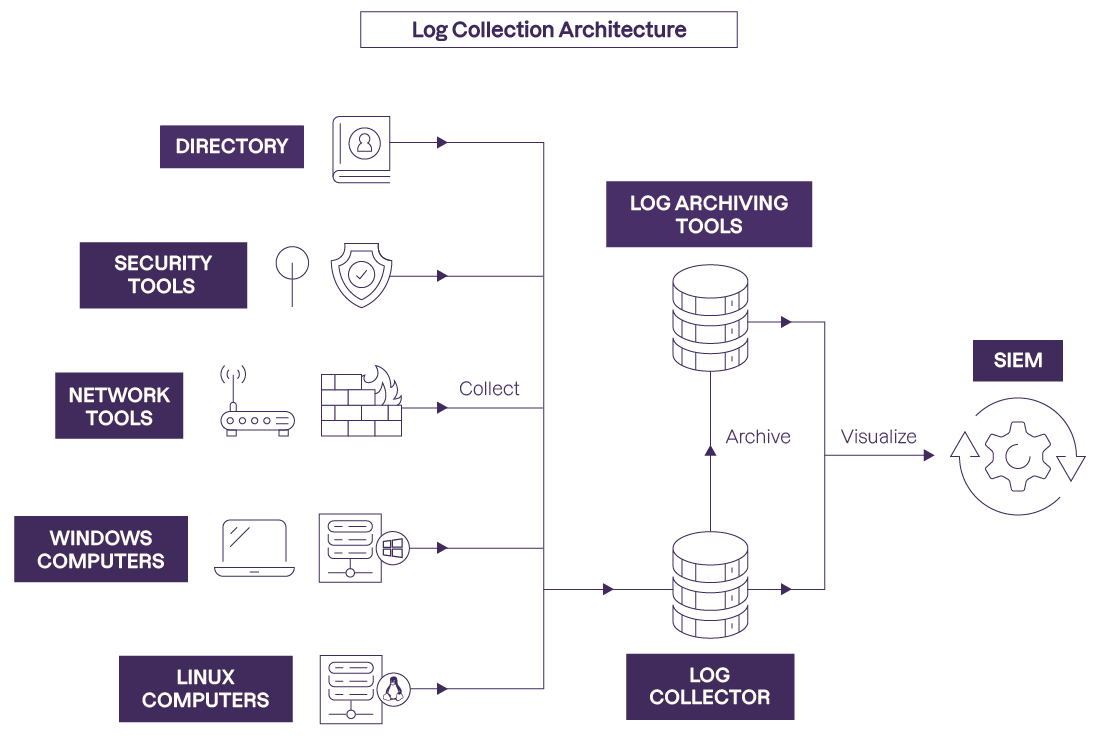
Once you’ve identified the supervised systems, you can design your secure log collection architecture. You will need:
a collection server to receive the logs, parse them, and standardize them for further processing.
a secure log archiving tool, which will store collected events according to the required retention policy.
a detection tool (which will be introduced in the next chapter).
Next, you’ll need to implement log transmission. To do this you can:
install a program on the various machines (known as an agent or forwarder).
use the system itself, which transfers all logs.

Over to You!

You’ll be joining the SOC at Méditronique. The SOC must detect the following risks:
The exploitation of a web vulnerability
An attacker moving around the office network
An attacker who compromises the credentials of a cloud-based office suite
To achieve this, you can collect the following logs from the company network:
EDR logs
System logs (workstations)
System logs (servers)
Firewall logs
Database logs
Web proxy logs
Wireless access point logs
Office network router logs
System logs (from virtual machines hosted in the cloud)
Mail server logs
Logs for cloud-based business applications
Logs for cloud-based office applications
Cloud provider connection logs
Web server application logs
Web server system logs
Fill in the following table with the logs to be collected from this list.
Events | Log(s) to Collect |
The exploitation of a web vulnerability |
|
An attacker moving around the office network |
|
An attacker compromising the login credentials of a cloud-based office suite |
|
Let’s Recap!
Network, system, and application components: Every event that occurs on a computer system can be recorded in a log.
In addition, security components like IDS, IPS, WAF, antivirus software, EPP, EDR, NDR, and XRD perform the first level of analysis and generate logs and alerts accordingly.
To determine which logs to enable, you can refer to the log management planning guides recommended by NIST, based on your risk analysis.
Storing logs and alerts requires a lot of storage space, so work gradually, one success at a time.
To make things easier and keep your system secure, you should collect and centralize your logs for guaranteed availability, simplified consultation, and easy backup and archiving.
Once this data has been collected, how can it be analyzed, linked together, and automated (if possible)?
This is the focus of the next chapter!
Et si vous obteniez un diplôme OpenClassrooms ?
- Formations jusqu’à 100 % financées
- Date de début flexible
- Projets professionnalisants
- Mentorat individuel
Trouvez la formation et le financement faits pour vous
