Table des matières
- Partie 1
Understand the problem in debugging code
- Partie 2
Manage the execution flow in a C# unit test
- Partie 3
Debugging data in C#
Table des matières
- Partie 1
Understand the problem in debugging code
- Partie 2
Manage the execution flow in a C# unit test
- Partie 3
Debugging data in C#
Stop on the right exception
Make use of the Test Explorer panel
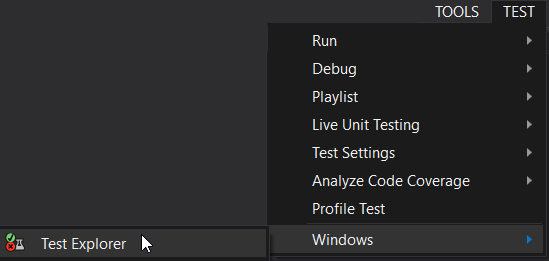
For the scenario where a test fails because of an unexpected exception, start with the Test Explorer panel. To access it, go into the TEST | Windows | Test Explorer menu:
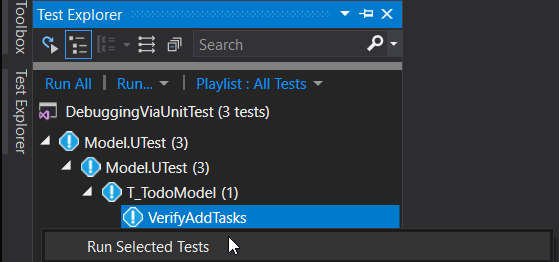
Select the VerifyAddTasks test, and run it by right-clicking Run Selected Tests:
Visual Studio’s Test Explorer panel results window provides a minimum of information to help you understand the cause of the test failure:
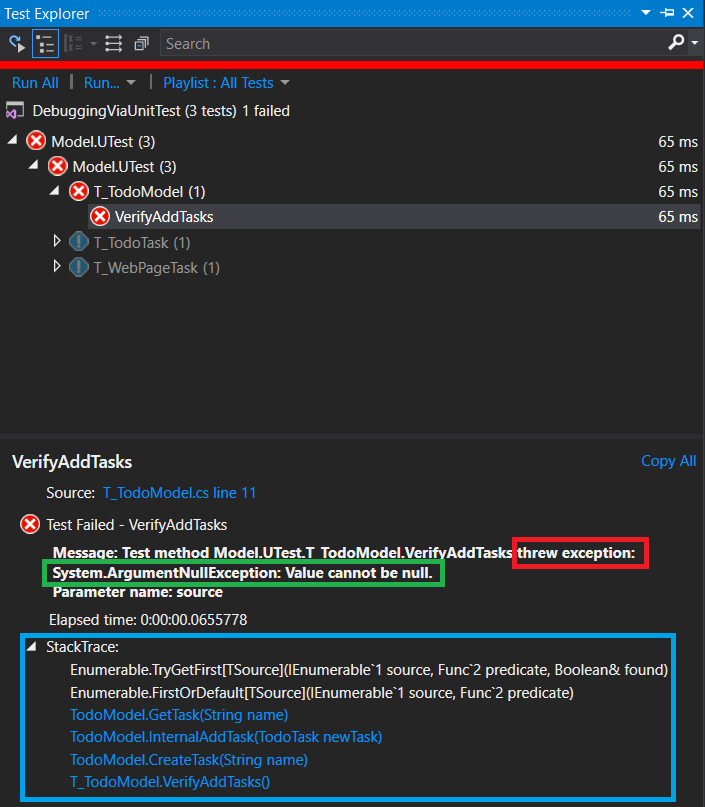
In the first instance, the failure comes from an exception thrown by the code (red box).
Next, the details of the exception in question are presented (green box):
Its type (here, an ArgumentNullException).
And message Value cannot be null.
What does this information give you?
The exception type, along with the message, indicates that a method has received an unsupported null value parameter. You need to determine which method this is, and who sent it a null. Note that the name of this parameter is given just below: source. This corresponds to the enumeration from which FirstOrDefault is called.
You can find part of the answer in the StackTrace section: the stack of method calls are displayed from the last one before the exception, up to the unit test (blue box).
Configure exception handling
Let’s get back to our investigation. Unfortunately, it’s too late to resolve the issue. :o
In fact, we should have asked the debugger to stop the execution at the exact place in the code where the exception was thrown and not when the test had failed.
To do this, you use the DEBUG | Windows | Exception Settings menu:

The panel that appears lists all the exception types that can be thrown:
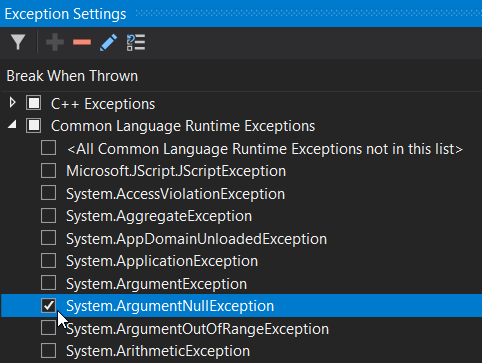
We’re only interested in those thrown in the .NET context, which appears in the Common Language Runtime Exceptions section. If you check the box alongside an exception (in our case, ArgumentNullException), the debugger will suspend execution, and the editor will show the instruction that throws the exception.
To make this behavior possible, this time run the test from the Debug command (instead of Run):

This means that the code will be run under the control of Visual Studio’s debugger.
The debugger will stop on the line of code that throws the exception. In our case, the call to the FirstOrDefault method:

The line in question is highlighted in the code editor, and a little box gives the details of the exception, like its message.
As you’re not familiar with the unit test code or the methods called there, it can be difficult to understand what's going on, and where you are in the execution. Fortunately, the call stack is automatically displayed in the Call Stack panel when the exception is detected. This enables you to understand where you are in the execution:
The exception occurred in the method at the top of the stack marked with the curved arrow, TodoModel.GetTask. It has appeared automatically in the Visual Studio code editor.
The next method in the stack, TodoModel.InternalAddTask corresponds to the one that called it. This way, you can go back until you know at where you are in the test. To do this, go down as far as the T_TodoModel method, and double-click on the line VerifyAddTasks (highlighted in blue on the previous screenshot):

The little curved arrow appears in both the call stack and the method code to indicate the instruction corresponding to the call to the TodoModel.CreateTask method, i.e., the line above in the call stack:
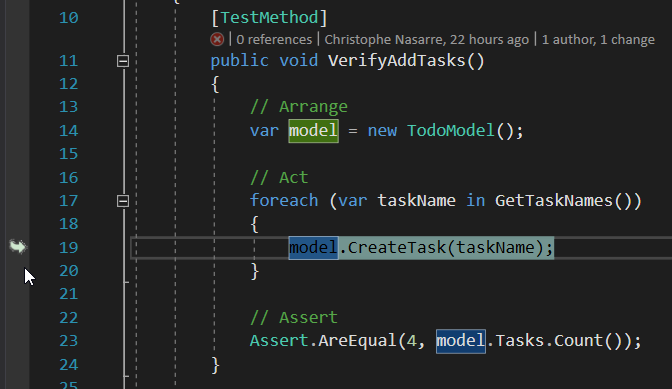
These selections enable you to find the sequence of method calls that resulted in the exception.
Going back to our investigation, the _tasks collection on which FirstOrDefault is called, seems not to be initialized. It would be interesting to find out the taskName value for which the exception was thrown. To do this, hover the mouse over it, and its value will be displayed directly in the editor – in our case, “sleep”:

We will go over the various means of viewing and modifying the values of the parameters and fields in data structures in more detail in the last chapter.
Let's recap!
You’ve just seen how to ask the debugger to stop as soon as an exception is thrown. You also saw the execution sequence for the methods using the Call Stack panel.
The question now is knowing how to ask the debugger to stop, not at the moment the exception is thrown, but at the place in the unit test that will lead to the error. It will then be possible to find the status of the local variables for each method, together with the values of the various parameters used in the successive calls.
The answer is in the next chapter! 😁
Et si vous obteniez un diplôme OpenClassrooms ?
- Formations jusqu’à 100 % financées
- Date de début flexible
- Projets professionnalisants
- Mentorat individuel
Trouvez la formation et le financement faits pour vous
