Measure the Impact of Your Digital Campaign
As mentioned before, you can't improve on what you can't measure. However, one great advantage of digital advertising is that you can measure almost everything. To do this, turn to web analytics.
How do web analytics works?
We are going to look at how to measure the effectiveness of your campaigns using these tools.
Measure Your Campaigns With Web Analytics
Web analytics brings together all of the audience measurement tools tied to your campaign that, for example, will link to a website or Facebook page.
These tools are the ultimate in quantitative measurement and allow you to get specific statistics. You can obtain the data collected on audience measurement platforms such as Google Analytics.
The Three Primary Web Analytic Metrics
The number of unique visitors. The number of people identified as unique who visit your website or Facebook page during a given period, typically a month. Their IP address and a cookie identify these visitors. An audience of 1,500 unique visitors per month means that 1,500 different internet users (1,500 different computers, to be precise) visited the site during the period. If the same internet user visits your site ten times over the period, the audience data counts ten visits and one unique visitor.
The number of visits. The number of internet users who will wander around your site to do something on it (read, acquire information, order, comment, etc.). It may seem like a must-have metric, but this isn't the case. If only one visitor represents all of the visits, then you are far from meeting your goals.
The number of page views. This indicates a page loaded (or reloaded) by a browser; it defines this as the total number of pages viewed.
Other Useful Metrics
The number of visitors. You can measure the impact in terms of attention. Website pages or a Facebook fan page are good sounding boards. The number of visitors before, during, and after the campaign indicates the interest generated and its potential effectiveness.
The average length of visit. You can gauge how interested a site visitor is by the time they spend on it. You have to verify that people find what they are looking for and that a long visit is not a sign of a poorly constructed site. Please note: for a visit on a single page, like a blog or a Facebook page, visit time is zero.
The number of visits per visitor. The ratio between the number of visits and visitors over a reference period.
The average number of page views per site. The ratio between the page views and the number of visits. It indicates the quality level of the content on your website or Facebook page.
Most visited pages. It highlights which content visitors are most interested in; if your ad campaign works properly, your most visited product pages generally represent the best sales. In the case of a Facebook page, you look at the engagement; you'll get more information, such as the number of unique visitors (reach).
The bounce rate. The percentage of visits that end after just one page.
The conversion rate. The percentage of visitors who converted into buyers during a visit to your site.
The click rate. Widely used to assess your display campaign's effectiveness in bringing about an action (a visit to your site, registration into a database, purchase, etc.).
If we perform the same exercise we ran with Google AdWords, when you project the different web analytics metrics onto the AIDA model, you get the following table:
AIDA Model | Metrics web analytics |
Attention | Number of visitors |
Interest | Average length of visit |
Desire | Average number of visits per visitor |
Action | Click rate |
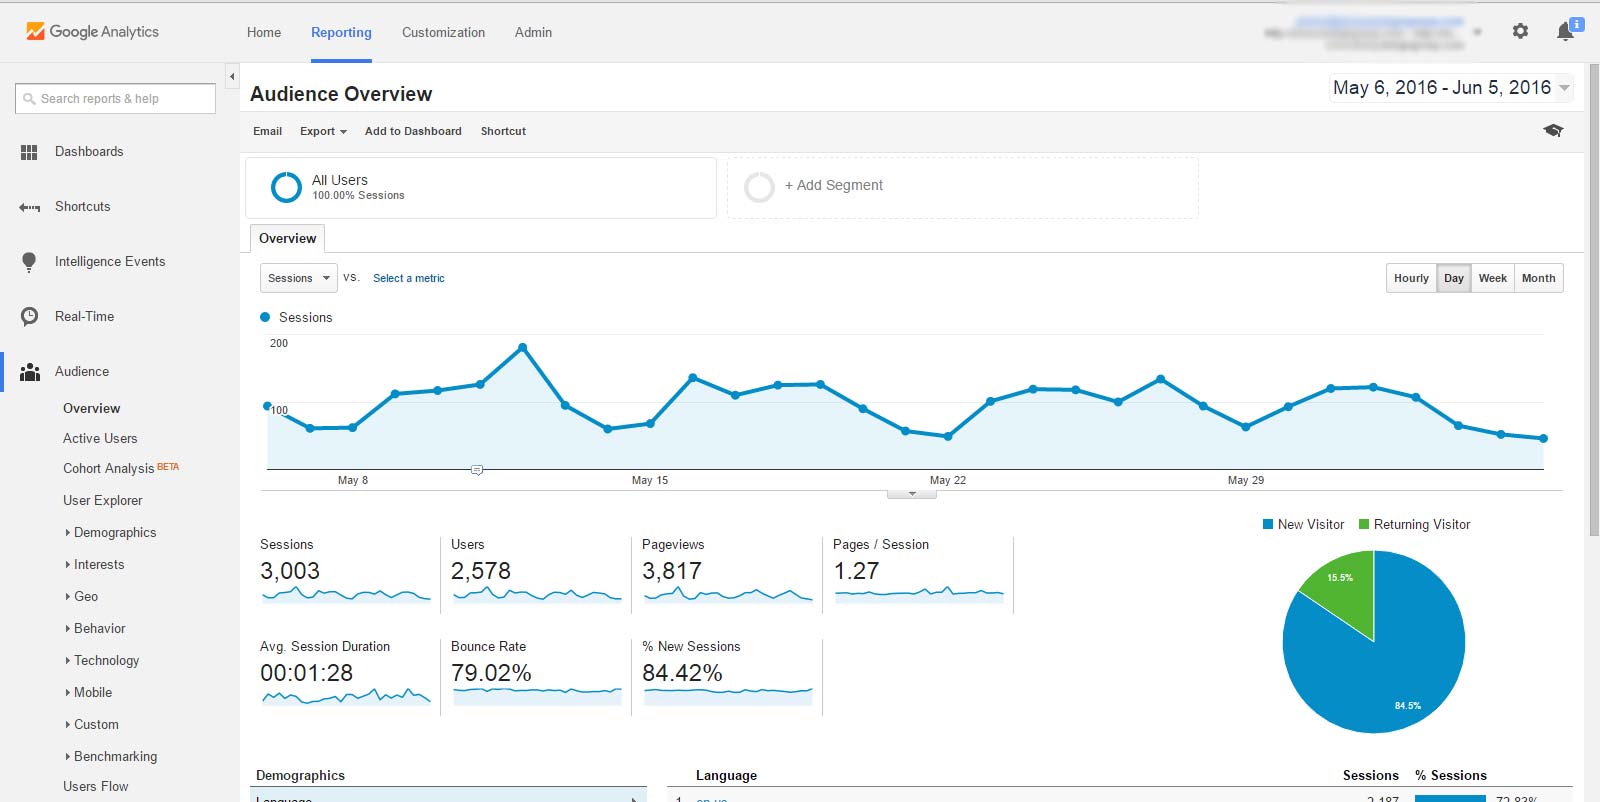
Measure Advertising Effectiveness With Google Analytics
To guage the effectiveness of your campaign, you can measure your audience metrics using Google Analytics.
There you find the number of unique visitors, visits per day, and duration.
Your audience measurement is based on two methodologies: one called site-centric, which focuses on the sites that constitute the sample of the measure, and the other user-centric, which focuses on the browsing behavior of individuals.
In each case, it is about measuring the audience, finding the number of visitors exposed to your campaign.
Here is a comparison between the AIDA method and advertising media KPIs.
AIDA Model | Advertising Media analytics |
Attention | Attention visits Unique visitors |
Interest | Single visitors |
Desire | Interaction indicators: click, click rate, conversion rate |
Action | Interaction indicators: click, click rate, conversion rate |
Let's Recap!
Define performance indicators that allow you to analyze and measure the effectiveness of your digital media plans.
Remember to properly define your KPIs before each campaign to give you qualitative and quantitative information to optimize your campaigns.
To properly monitor your advertising strategy, use dashboards, enabling you to monitor and analyze the different KPIs to constantly know your ad campaign's progress and make the necessary internal reports.
In the last chapter, you will see how to calculate the costs of your campaign.
